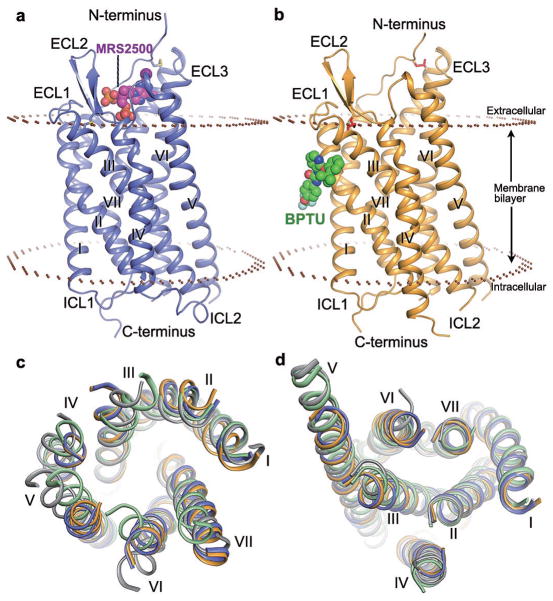
Figure 1. Structures of the P2Y1R-MRS2500 and P2Y1R-BPTU complexes.
a and b, Side view of the P2Y1R-MRS2500 (a) and P2Y1R-BPTU (b) structures. The receptor is shown in blue (a) and orange (b) cartoon representation. The ligands MRS2500 and BPTU are shown in sphere representation with magenta and green carbons, respectively. The disulfide bonds are shown as yellow (a) and red (b) sticks. The membrane boundaries (brown) are adapted from the OPM database31 with P2Y12R (PDB ID: 4NTJ) as a model. c and d, Structural comparison of the helical bundles between P2Y1R and P2Y12R. (c) Top view of the extracellular side; (d) bottom view of the intracellular side. The receptors are in cartoon representation. The P2Y1R-MRS2500, P2Y1R-BPTU, P2Y12R-AZD1283 (PDB ID: 4NTJ) and P2Y12R-2MeSADP (PDB ID: 4PXZ) structures are colored blue, orange, grey and green, respectively.

