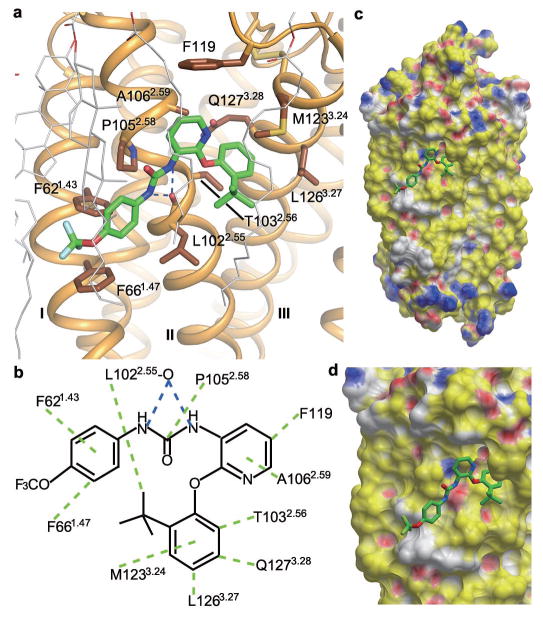
Figure 4. P2Y1R ligand binding pocket for BPTU.
a, Key residues in P2Y1R for BPTU binding. BPTU (green carbons) and P2Y1R residues (brown carbons) involved in ligand binding are shown in stick representation. The receptor is shown in orange cartoon representation. Lipid molecules in close contacts with BPTU are shown in white line representation. Hydrogen bonds are blue dashed lines. b, Schematic representation of interactions between P2Y1R and BPTU. Hydrophobic interactions are green dashed lines. The BPTU binding site remains intact in the P2Y1R-MRS2500 complex. c and d, Side view (c) and zoom-in view (d) of the BPTU ligand binding site in P2Y1R. The receptor is shown in molecular surface representation and colored by binding property (Yellow: hydrophobic surface; red: hydrogen bond acceptor potential; blue: hydrogen bond donor potential; white: neutral surface). The figure was prepared using ICM software (http://www.molsoft.com).

