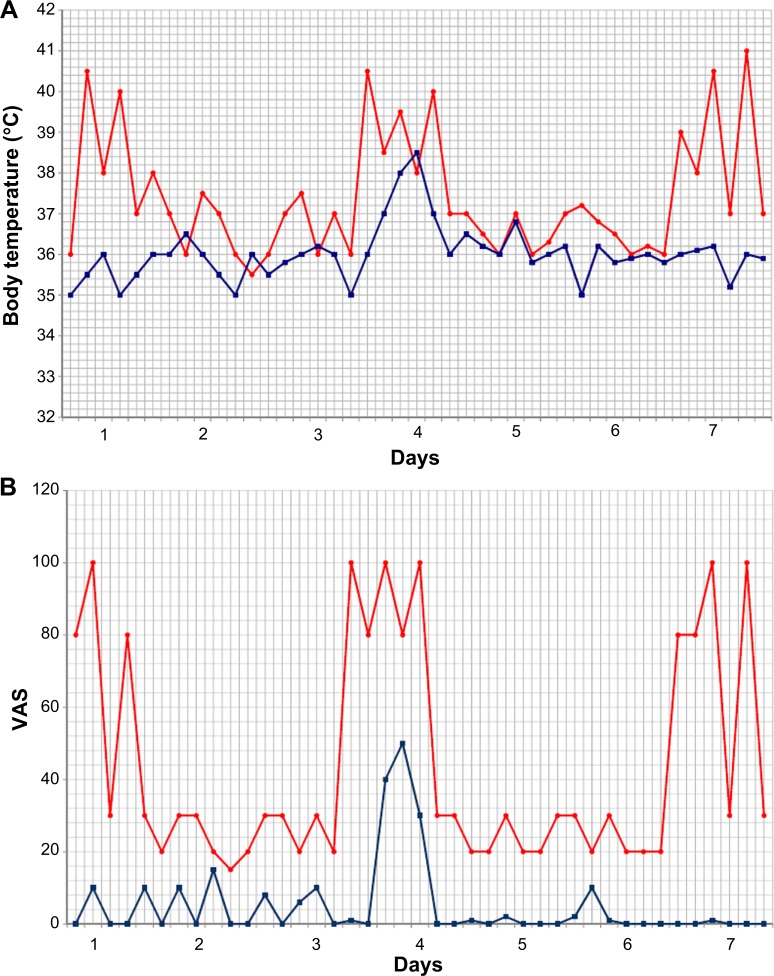
Figure 1.
Effect of canakinumab on thermal curves and its impact on VAS.
Notes: (A) Thermal curves of the week preceding (red line) and the week following the administration of the first dose of canakinumab (blue line). (B) VAS values of the week preceding (red line) and the week following the administration of the first dose of canakinumab (blue line).
Abbreviation: VAS, visual analog scale.

