
Figure 3.
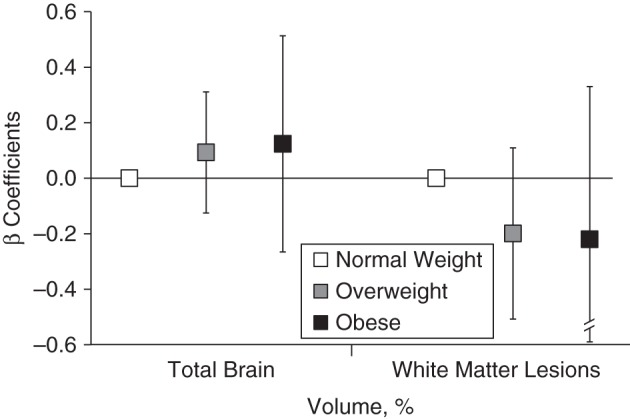
Associations of midlife overweight, obesity, and normal weight with total brain volume and white matter lesion volume relative to intracranial volume, the Age, Gene/Environment Susceptibility-Reykjavik Study, 1967–2006 (n = 3,864). β coefficients represent the unit changes in percentage of total brain volume and percentage of white matter lesion volume for overweight (body mass index (weight (kg)/height (m)2 of 25–29.9) and obese (body mass index ≥30) participants compared with normal weight (body mass index of 18.5–24.9) participants from multivariate linear regression models that were adjusted for sex, age in midlife, number of follow-up years, Apolipoprotein ε4 allele, educational level, intracranial volume, physical activity level, systolic and diastolic blood pressure, and serum cholesterol level in midlife and for coronary artery calcium, prevalent coronary heart disease, hypertension, diabetes, depression, and drinking and smoking status in late life. The models for percentage of total brain volume are further adjusted for infarct-like brain lesions. Bars, 95% confidence intervals.