
Figure 4.
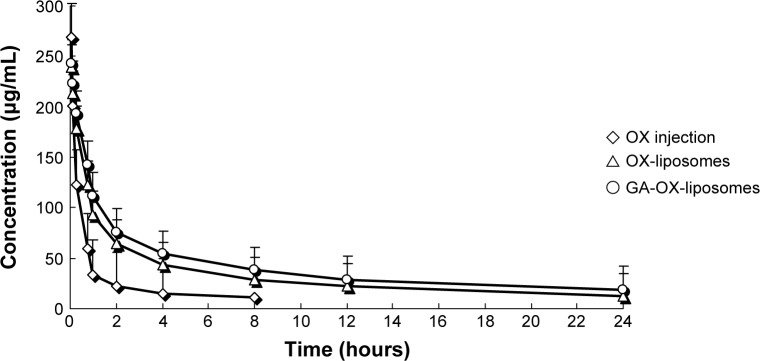
Mean plasma concentration–time profiles of OX after IV administration of a single 20 mg/kg dose of free OX and liposomes to rats.
Note: Each point represents the mean ± SD of six rats.
Abbreviations: GA, glycyrrhetinic acid; IV, intravenous; OX, oxaliplatin; SD, standard deviation.