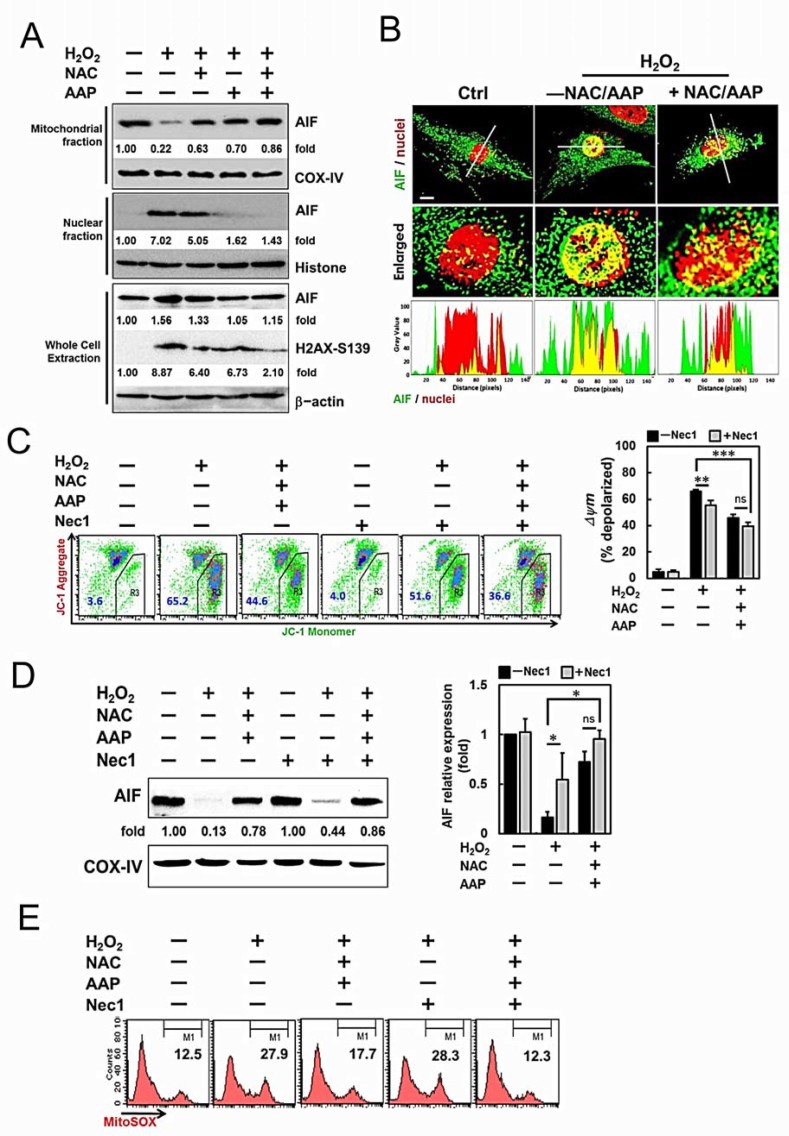
Figure 4. AIF/H2AX pathway was involved in the protective effect of NAC and AAP.
(A) Expression of AIF and H2AX proteins in hADMSCs pretreated with NAC or/and AAP were assessed by western blot. COX-IV and Histone were used as mitochondrial and nuclear internal controls, respectively. The changes of each band were expressed as fold-changes as compared to the internal controls. (B) Analysis of fluorescence intensities by confocal microscopy revealed the co-localization of AIF (green fluorescence) in the nuclei (red fluorescence). In the enlarged pictures, the overlapping of the fluorescence (yellow) decreased in NAC/AAP-treated cells. Histograms demonstrate the fluorescence intensity profiles along the lines indicated in the upper row images. (C) Mitochondrial membrane potential changes of hADMSCs treated with NAC/AAP for 4 h in the absence or presence of Nec1 were analyzed by flow cytometry after JC-1 staining. Quantitative analysis of the green fluorescence (JC-1 monomer) showed that the NAC/AAP decreased green fluorescence in the absence or presence of Nec1 (right panel). (D) The expression of AIF protein in the mitochondrial fraction of hADMSCs pretreated with or without NAC/AAP was assessed at the absence or presence of Nec1 by western blot. COX-IV was used as mitochondrial internal control. Summary of normalized values of AIF in the mitochondrial fractions of hADMSCs.is shown at the right panel. (E) Mitochondrial ROS is shown in the representative histogram of unfixed cells analyzed by flow cytometry after MitoSOX staining. The values indicate the percentage of cells in the marked (M1) regions. Scale bar = 10 µm. * p < 0.05, ** p < 0.01, *** p < 0.001. ns, not significant.

