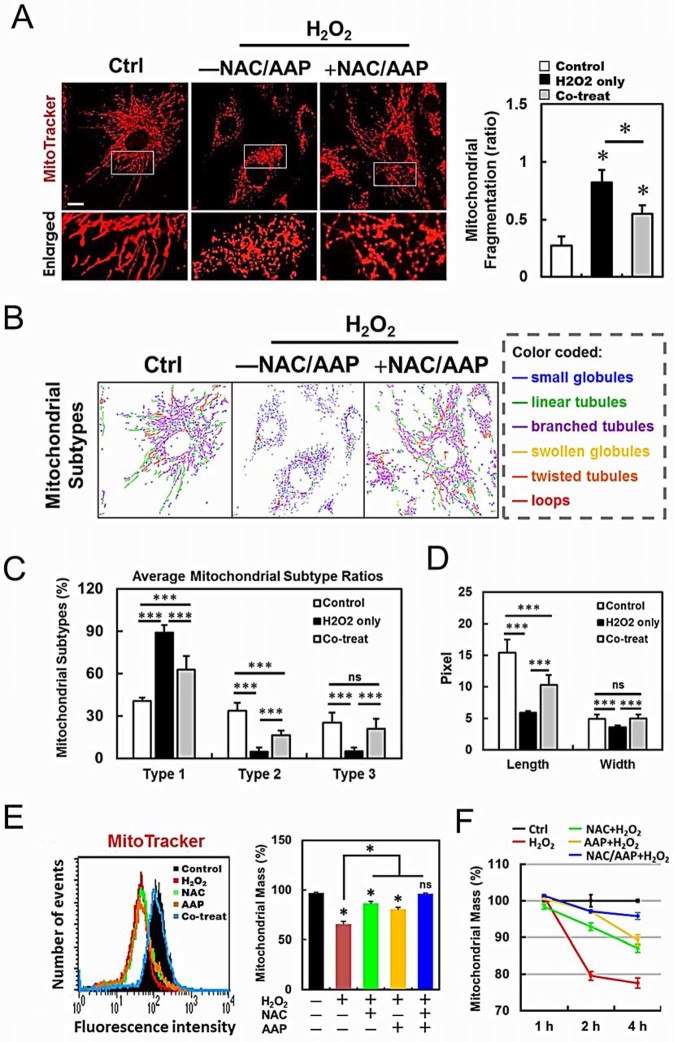
Figure 6. NAC/AAP protected mitochondria against oxidative stress.
(A) hADMSCs were stained with MitoTracker Red and observed by confocol microscopy to analyze the mitochondrial network structure. The acquired images were filtered, and thresholded to identify mitochondrial fragments using ImageJ software. The particle number was normalized to the total mitochondrial area to calculate the MFC (mitochondria fragmentation counting). The ratio changes are shown at the right panel. (B) MicroP software classifies mitochondria in each cell into three categories according to the features of mitochondrial morphology. (C and D) The proportions of different categories of mitochondria obtained from various treatments are shown in (C), and the changes in length and width of the mitochondria are shown in (D). The effects of NAC or/and AAP protection on mitochondrial mass are shown in E: hADMSCs of various treatments were stained with MitoTracker Red, and their mitochondrial mass were measured by flow cytometry at different time points (F). The data were expressed as a percentage to the non-treated control, which was set at 100%. Scale bar = 10 µm. * p < 0.05, ** p < 0.01, *** p < 0.001. ns, not significant.

