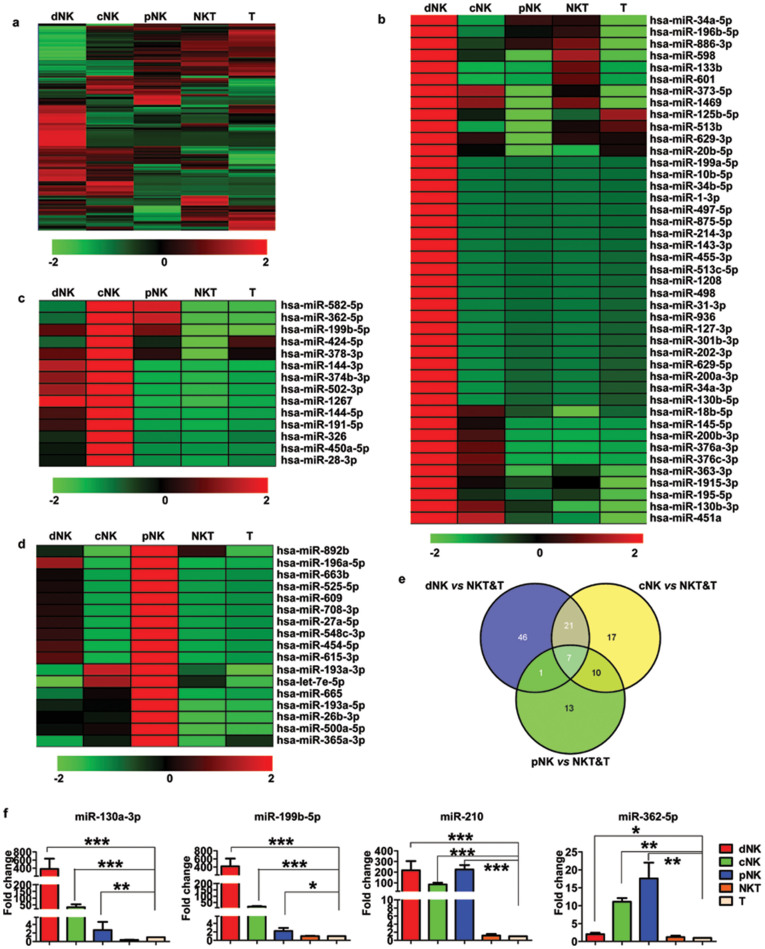
Figure 1. Expression profiles of miRNAs among different lymphocyte subsets.
(a) Hierarchical cluster analysis of differentially expressed miRNAs in various cell subsets. (b–d) Heat map of the signature miRNAs for the dNK (b), cNK (c) and pNK (d) subsets: miRNAs with differences were selected by the expression with a fold change of two or greater in each subset when compared with the remaining four subsets. (e) The Venn diagram shows the number of all differentially expressed miRNAs across the following comparisons: dNK vs. NKT and T, cNK vs. NKT and T, and pNK vs. NKT and T. The number of differentially expressed miRNAs from each comparison is indicated. (f) Quantitative RT-PCR validation of the expression of miR-130a, miR-199b-5p, miR-210, and miR-362-5p in dNK, cNK, pNK, NKT, and T cells. RNU6B was used as an internal control for real-time PCR. Data are representative of three to six experiments. *P < 0.05, **P < 0.01, and ***P < 0.005 (Student's t-test).

