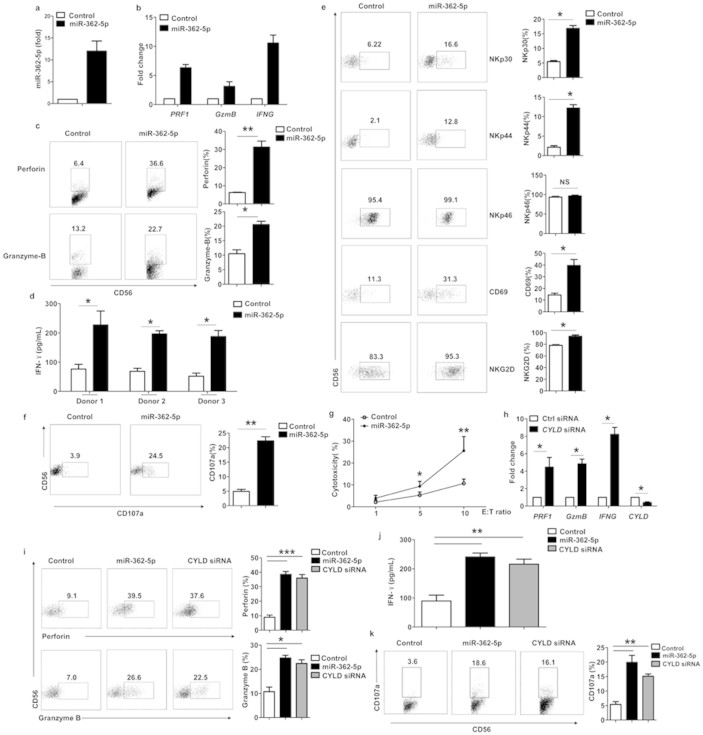
Figure 5. Overexpression of miR-362-5p promotes human NK cell effector function.
(a–b) Quantitative RT-PCR assay of miR-362-5p (a) and PRF1, GzmB, and IFNG (b) in dNK cells transfected with miR-362-5p mimics. (c) Flow cytometry analysis of the expression of perforin, granzyme-B in purified human dNK cells transfected with miR-362-5p mimics or miRNA with scrambled sequence (Control). The graphs show the average relative frequency of all perforin+ or granzyme B+ dNK cells. (d) ELISA of IFN-γ in the supernatants of purified dNK cells transfected with miR-362-5p mimics or control miRNA that were stimulated overnight with IL-2 (100 U/ml), IL-12 (10 ng/ml), and IL-18 (100 ng/ml), beginning 20 h after transfection. Data represent mean of three independent wells. *P < 0.05 among all three donors for control versus miR-362-5p. (e) Flow cytometry analysis of the surface expression of NKp30, NKp44, NKp46, CD69, and NKG2D in dNK cells in c. The graphs show the average relative frequency of all NKp30+, NKp44+, NKp46+, CD69+, and NKG2D+ dNK cells. (F) Flow cytometry for CD107a expression in dNK in c. The graphs show the average relative frequency of CD107a+ dNK cells as above. (g) Flow cytometry assay evaluating the cytotoxic activity of dNK cells in c. Results are expressed as mean ± SEM of triplicate wells from one representative experiment of three experiments completed. (h) Quantitative RT-PCR analysis of PRF1, GzmB, IFNG, and CYLD expression in dNK cells transfected with CYLD siRNA or control siRNA (Ctrl siRNA). Data are representative of three independent experiments with similar results. (i) Intracellular staining of perforin and granzyme-B in purified dNK cells transfected by nucleofection with miR-362-5p mimics, negative control, or CYLD siRNA. (j) ELISA of IFN-γ in the supernatants of purified dNK cells in I. that were stimulated overnight with IL-2 (100 U/ml), IL-12 (10 ng/ml), and IL-18 (100 ng/ml), beginning 20 h after transfection. (K) Flow cytometry for CD107a expression in purified dNK cells in i. Data are representative of three independent experiments (mean ± SEM). *P < 0.05, **P < 0.01 and ***P < 0.005 (Student's t-test).

