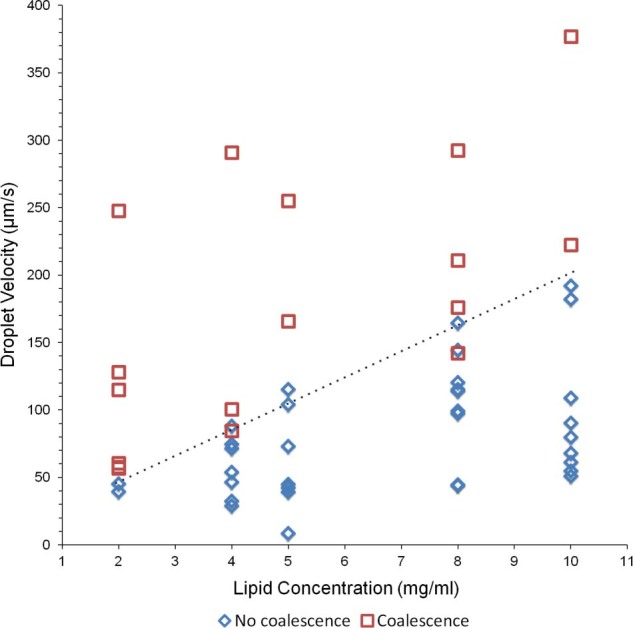
Figure 2. Relationship between droplet velocity and lipid concentration.

The aqueous phase was a physiological buffer, the oil phase was hexadecane and asolectin was dissolved in one phase only or in both. At higher lipid concentrations and lower droplet velocities, droplets became less susceptible to coalescence upon contact within the registers. The dashed line shows an approximately linear dependence between lipid concentrations and droplet velocity.
