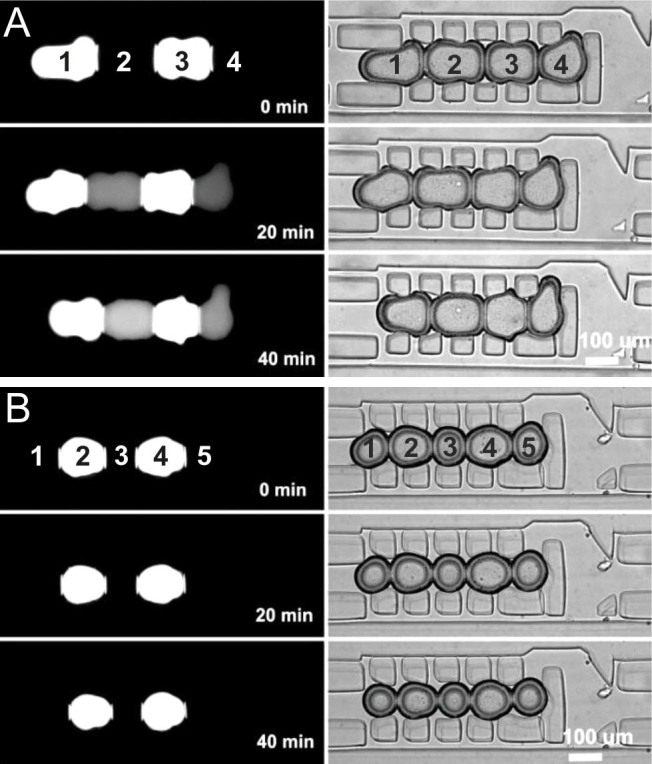
Figure 3. Passive molecular transport across microfluidic DIBs (A & B).

Fluorescent (donor) and non-fluorescent (acceptor) droplets were trapped within registers and images where acquired every 5 minutes for 1 hour. The left hand column shows fluorescence microscopy images taken using a FITC filter. The corresponding bright field can be seen in the right hand column. 10 mg/ml asolectin was used and fluorescent droplets contained either 100 µM fluorescein (A) or 100 µM calcein (B). Fluorescein was clearly observed to leak through the lipid layer, increasing the fluorescent contents of adjacent droplets whilst calcein did not permeate through to the neighbouring droplet over the same time period.
