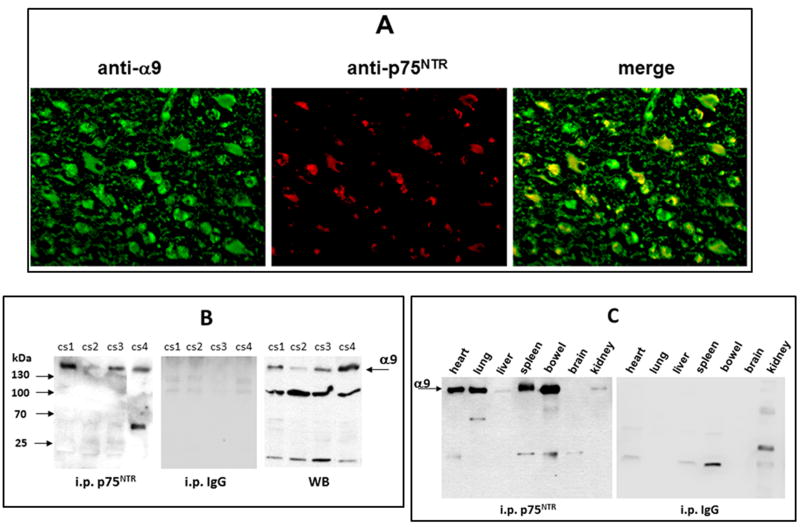
Fig. 4.
Detection of the α9/p75NTR complex in vivo in GBM and normal tissues. (A) Representative images of immunohistochemical detection of co-localization of α9 and p75NTR in the paraffin sections of human GBM. The slides were incubated with polyclonal anti-α9 integrin subunit (green) and with anti-p75NTR mab (red). Co-localization areas of both receptors are in yellow. Pearson’s coefficient was calculated as approximately 1. (B) Immunoprecipitation of α9/p75NTR complex by p75NTR mab from human surgical GBM tissue lystes of four cases. Detection of α9 integrin subunit was performed in WB by anti-α9 polyclonal. I.p. by isotopic IgG was performed as a control. Presence of α9 integrin in tissue lysates before i.p. (direct Western blot) is presented in right panel. (C) Immunoprecipitation of α9/p75NTR complex by p75NTR mab from lysates of different rat organs. Isotopic IgG was used for control.

