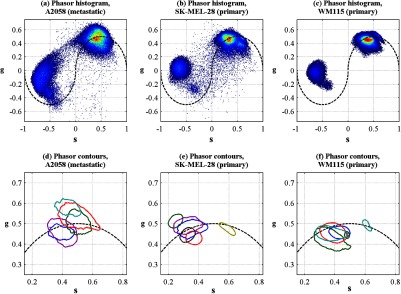
Fig. 10.

Top row: cumulative phasor histograms. Bottom row: phasor contours, zoomed into upper-right quadrant (positive pump–probe signals only). Each color represents the 50% contour of a cumulative phasor histogram for a different animal. Left: A2058 cell line, sourced from a lymph node metastasis. Center: SK-MEL-28 cell line, sourced from primary tumor. Right: WM115 cell line, sourced from a vertical growth phase primary tumor with confirmed metastases.
