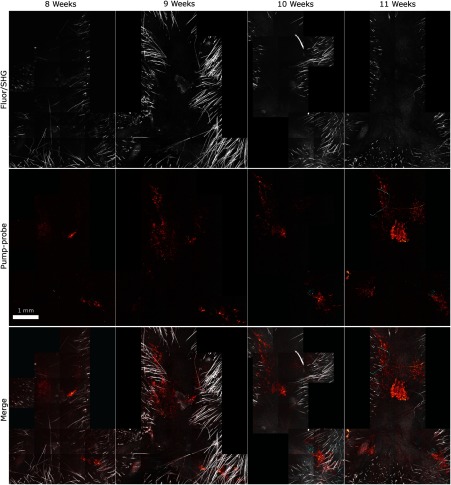
Fig. 3.
Pump–probe imaging tracking tumor development over several weeks. Pump–probe delay is 280 fs. Grayscale: multiphoton autofluorescence and SHG signal collected by photomultiplier tube. Red/yellow: pump–probe positive response. Blue/cyan: pump–probe negative response. Acquisition times: 8th week, , 3.5 min total; 9th week, , 4.2 min total; 10th week, , 2.7 min total; 11th week, , 1.7 min total.

