
Fig. 4.
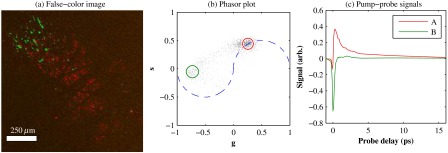
pump–probe delay stack. Approximately 84 mW delivered to specimen through objective, pixel dwell time. (a) False-color image of pump–probe stack. (b) Phasor histogram (at 0.25 THz) with pixels having excited-state absorption response circled in red (region A), and ground-state depletion response circled in green. (c) Averaged response from regions A and B. Signals normalized to have root mean square value of 1. Acquisition time: 3 min for a delay stack.