Fig. 5.

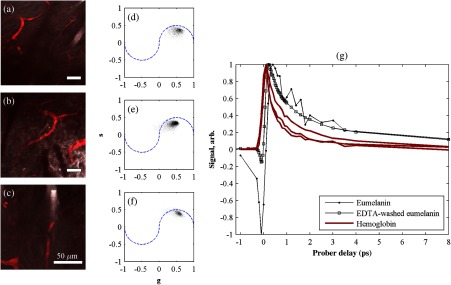
Imaging of vasculature in vivo. (a–c) False-color images of three delay stacks that show clear vasculature structure in pump–probe channel (sum across pump–probe delay shown in red); fluorescence/SHG overlaid in grayscale for context. (d–f) Corresponding phasor histograms (0.25 THz) of in vivo hemoglobin response. (g) Averaged in vivo hemoglobin response for each of the images shown (red lines), compared with eumelanin and EDTA-washed eumelanin pump–probe response (black lines). Scale bars . Acquisition times: (a) 3 min for delay stack; (b) 11 min for delay stack; and (c) 3 min for a delay stack.
