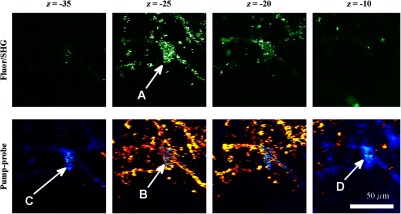
Fig. 9.

z-stack of pigmented cells under high-intensity illumination (approximately 85 mW total power delivered to specimen through a dry objective, pixel dwell time). Top row: multiphoton fluorescence/SHG; bottom row: pump–probe at zero time delay. In the most densely pigmented regions, fluorescence/SHG image shows bright, grainy appearance (A), while pump–probe image shows bright, grainy, positive, and negative fluctuating signals (B). Although pump–probe signal is primarily positive (red/yellow) when in-focus, indicating eumelanin, the pump–probe signal is negative (blue) when focal plane is below (C) and above (D) the pigment. Scale bar ; all images have same scale. Acquisition times: frame.
