
Fig 5. Western blot analysis of the ratio between phosphorylated PKB/AKT versus total PKB/AKT in the gastrocnemius muscle removed from F1-HF0 and F1-HFp mice stimulated or not by insulin (the fold stimulation by insulin, relative to the mean of the corresponding control without insulin was assigned above each band shown).
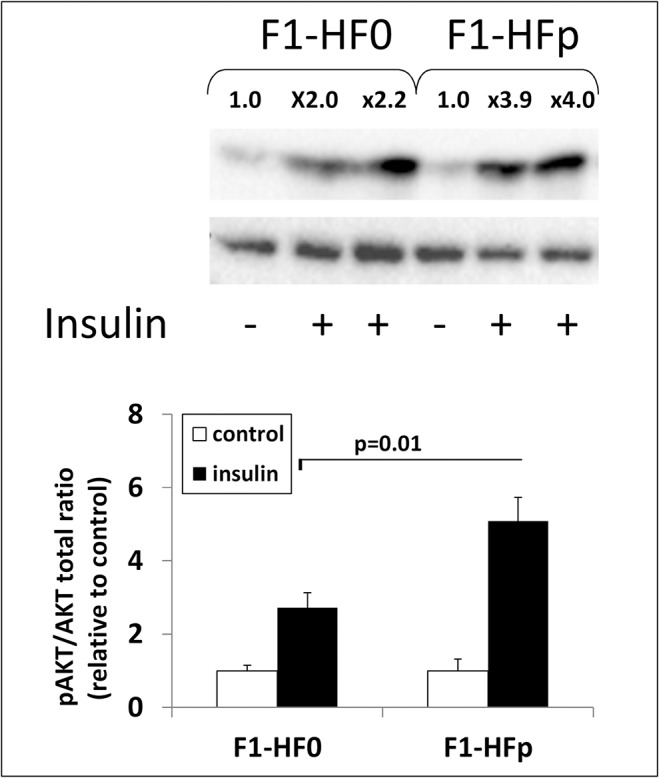
For quantification, each blot has been hybridized to α-tubulin and the graphs below represent means ± SE; *p<0.05 relatively to the F1-HF0 group; n = 7–8 mice.