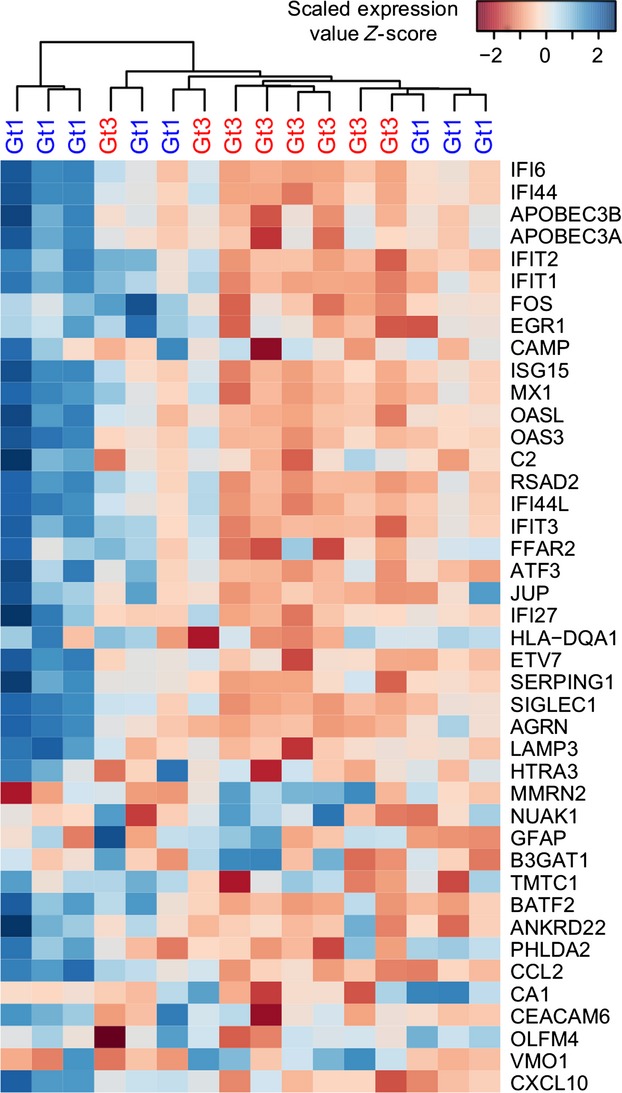
Figure 1.

Heat map of genes identified as differentially expressed between gt1- (n = 8; blue labels) and gt3-infected patients (n = 8; red labels). Microarray signal values were log-transformed, scaled using Z-score (dark blue denotes higher and dark red denotes lower), and then clustered based on Euclidean distance metrics using the hclust R package.
