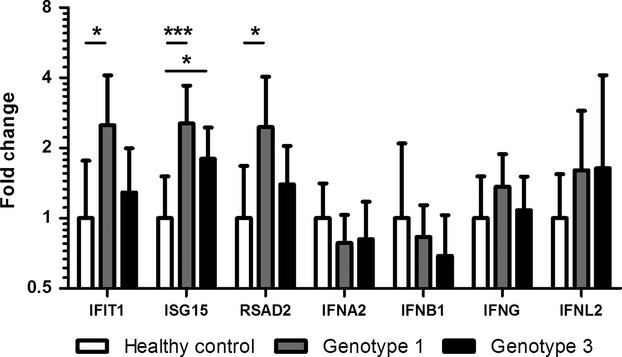
Figure 3.

Validation of microarray results and transcription of IFNs using Q-PCR in gt1- (n = 22) and gt3-infected patients (n = 22), and healthy controls (n = 15). For IFNA2 n = 17 gt1, 19 gt3 and 11 healthy controls; for IFNB1 n = 10 gt1, 10 gt3 and six healthy controls; and for IFNL2 n = 8 gt1, 10 gt3 and eight healthy controls. Plots show geometric mean with 95% confidence interval. *denotes P-value <0.05 and ***denotes P-value <0.001.
