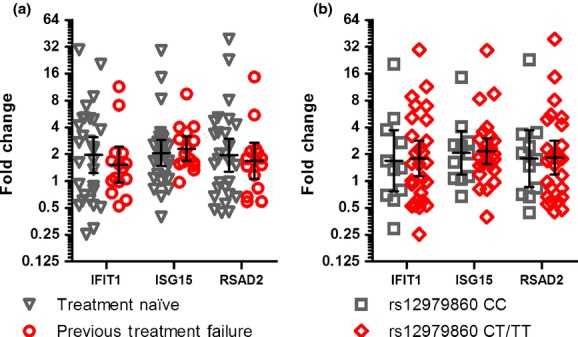
Figure 4.

Transcription of genotype-specific genes IFIT1,ISG15 and RSAD2. (a) Impact of previous treatment failure comparing treatment naive patients (n = 29) and patients who have previously failed IFN-based therapy (n = 15). (b) Impact of IL28B genotype comparing patients with the favourable ‘CC’ genotype (n = 11) and patients with the unfavourable ‘CT/TT’ genotypes (n = 27). Plots show geometric mean with 95% confidence interval.
