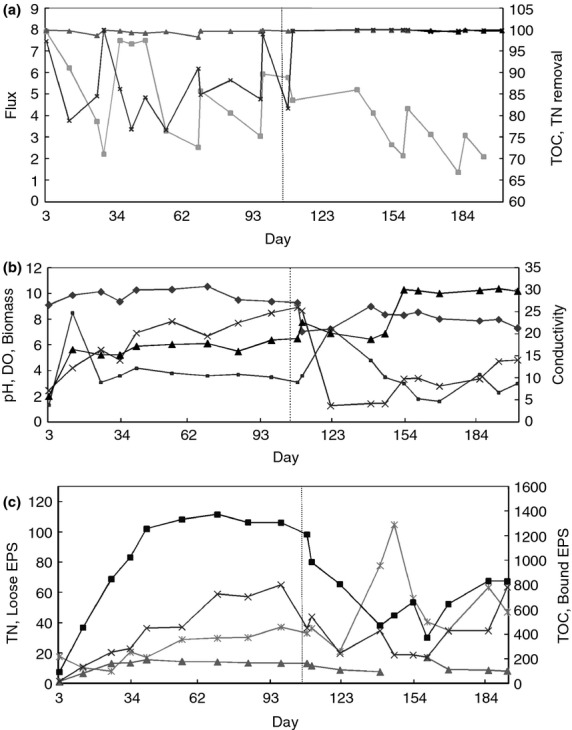
Figure 1.

Membrane distillation bioreactor (MDBR) performance and environmental variables of an MDBR over 202 days of operation. (a) Values of flux (LMH, ▪) are plotted on the primary vertical axis; total organic carbon (TOC) removal efficiency (%, ▴) and total nitrogen (TN) removal efficiency (%, ×) are plotted on the secondary axis. (b) pH (♦), dissolved oxygen (DO) (mg l−1, ▪), biomass (g l−1, ×) are plotted on the primary vertical axis, and conductivity (mS cm−1, ▴) on the secondary axis. (c) TN (mg l−1, ▴) and soluble extracellular polymeric substances (EPS) (mg l−1, ×) are plotted on the primary axis while TOC (mg l−1, ▪) and bound EPS (mg l−1, *) are plotted on the secondary axis. The pH was adjusted from the 106th day onwards (dash line).
