
Figure 2.
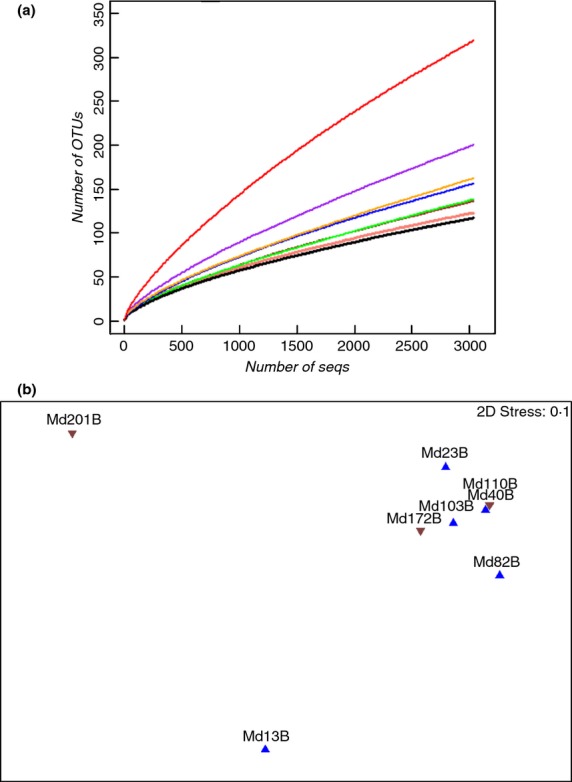
Rarefaction curves (a) and nonmetric multidimentional scaling (NMDS) (b) of eight MD bacterial communities. The samples before pH adjustment are shown as “ ” and after pH adjustment are represented by ‘
 ’. All the datasets were normalized to have the same number of reads (3034), and an operational taxonomic unit was defined to be no more than 3% distance within one unit. The stress of NMDS plot was set to be 0·1 at minimum to discern the position of all the samples. (
 ) Md13B; (
 ) Md23B; (
 ) Md40B; (
 ) Md82B; (
 ) Md103B; (
 ) Md110B; (
 ) Md172B and (
 ) Md20lB