Figure 5.

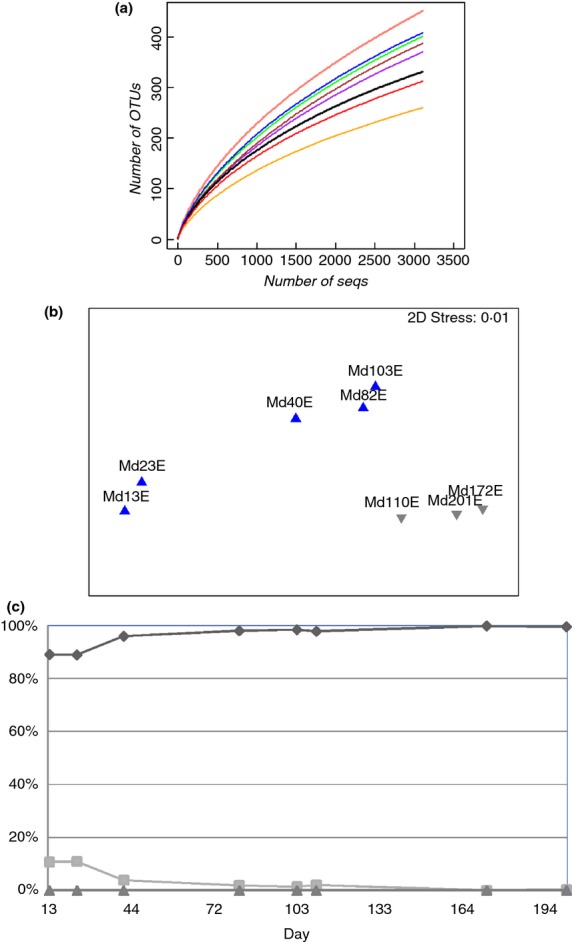
Rarefaction curves (a), nonmetric multidimentional scaling (b) of eight eukaryotic communities at a 3% cut-off and community composition at the kingdom level (c). All the datasets were normalized to have 3108 reads. The samples before pH adjustment are shown as ‘ ’ and after pH adjustment are represented by ‘
 ’ (b). (c) All the reads which obtained using the primer set euk7F-euk570R were aligned to the SILVA database, and are shown as relative percent abundance. The eukaryotic groups are: Fungi (♦), Amoebozoa (▴) and Unclassified (▪). (
 ) Md13E; (
 ) Md23E (
 ) Md40E (
 ) Md82E; (
 )Md103E; (
 ) Md110E; (
 ) Md172E and (
 ) Md201E.
