Figure 11.
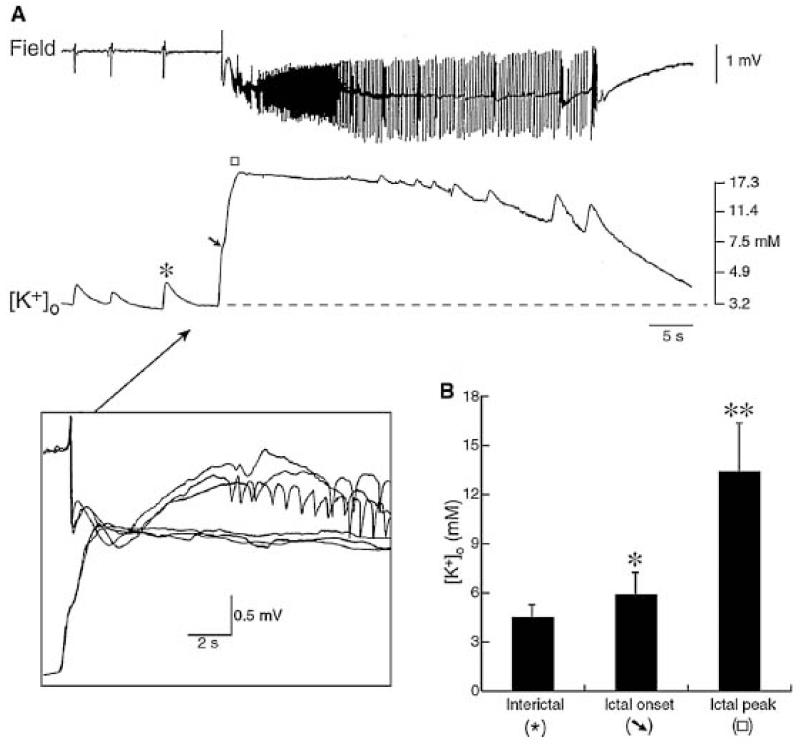
A: Extracellular K+ concentration ([K+]o) dynamics during epileptic activities (From D’Antuono et al., 2004).
[K+]o increases up to 4.5 mM accompany the isolated negative field events (asterisk), while an elevation up to 6.4 mM characterizes the field potential leading to the ictal discharge onset (arrow). The insert, which represents three graphically superimposed ictal onsets at faster time base, demonstrates that the initial increase in [K+]o occurs at the same time as the initial positive–negative field event, while the slower secondary negative field event follows the peak of the elevation in [K+]o.
B: Quantitative summary of the maximal elevations in [K+]o associated with the isolated negative-going events, those occurring during the negative-going events preceding ictal discharge and during the ongoing ictal activity (identified as ictal peak).

