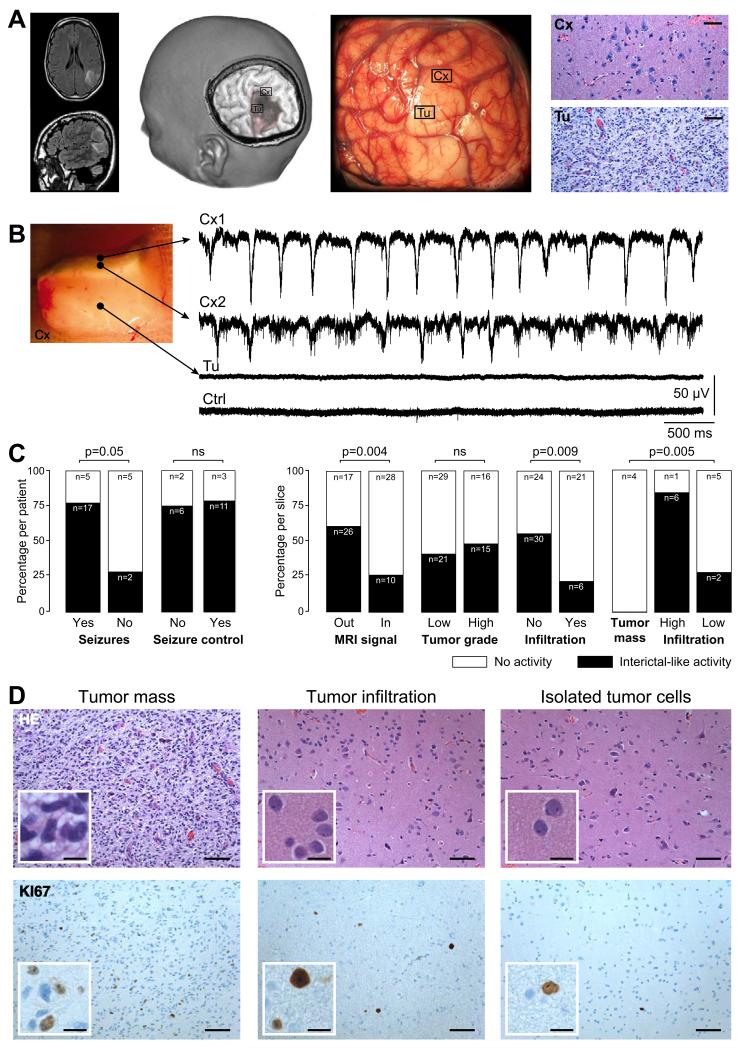
Figure 1. Interictal-like discharges are generated in the human neocortex infiltrated by glioma cells.
(A) Example of a left parietal low-grade (World Health Organization grade II) glioma. The tumor appears as a hypersignal area on a Fluid Attenuated Inversion Recovery (FLAIR) sequence (left), as a hyposignal area on a three-dimensional spoiled gradient sequence (mid left) and as pale, hypertrophied and infiltrated, gyri on intraoperative photographs (mid right). Brain tissue specimens were sampled inside (Tu) and outside (Cx) macroscopic tumor infiltration. In areas outside visible tumor abnormalities (Cx) we detected only an infiltration by glioma cells (hematoxylin and eosin (HE) staining, x200). Tumor infiltration was obvious in tissue from areas of visible imaging tumor abnormalities (Tu; HE staining, x200). Scale, 100 μm.
(B) Multiple extracellular recordings of interictal-like discharges (IIDs) from a slice containing both the solid tumor component and adjacent infiltrated neocortex. Electrode locations: Cx1, superficial neocortical layer; Cx2, mid neocortical layers, Tu, solid tumor tissue. Crtl shows a record from non-infiltrated neocortex in another control specimen.
(C) The proportion from which IIDs were (black) or were not (white) detected, compared to history of seizures (29 patients), preoperative seizures control with antiepileptic drugs (22 patients), position with respect to structural abnormalities (81 slices; inside Vs outside regions of FLAIR hypersignal on MRI), tumor grade (81 slices; low-grade Vs high-grade), tumor infiltration (81 slices Vs control 14 slices), and indices (18 slices) of tumor core (n=4), high tumor infiltration (n=7) or low tumor infiltration by isolated tumor cells (n=7) from histopathological analyses.
(D) Classical histolopathogical features of a glioma. The tumor mass (left), and regions with tumor infiltration (middle) and with isolated glioma cells (right) are shown with HE (upper) and Ki67 (lower) stains. Scales: 100 μm and 25 μm for the insets.

