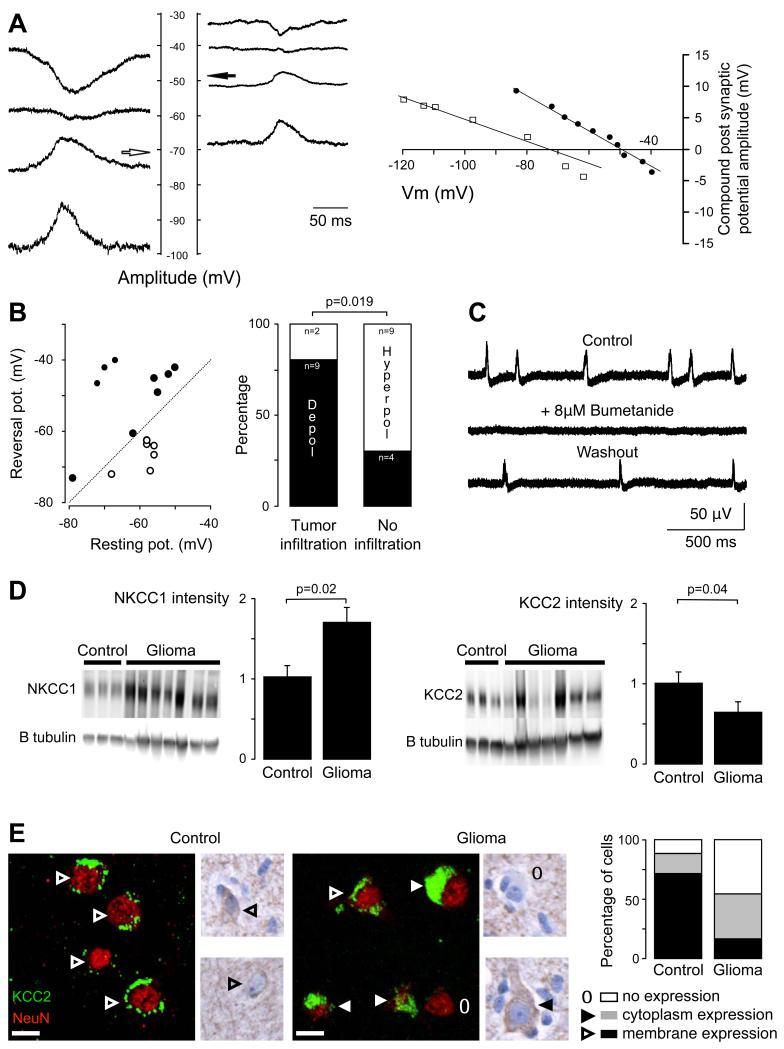
Figure 4. Cl− regulation impairment contributes to interictal-like discharges.
(A) GABAA reversal potential (Vrev) in pyramidal cells. PSP amplitude during interictal-like discharges (IIDs) was measured in pyramidal cells of infiltrated neocortex maintained at different potentials. Records are shown (at the left) and plotted (at right) from one cell with a Vrev of – 71 mV (white arrow and plotted open squares) and another cell with Vrev values of – 48 mV (black arrow and plotted filled circle).
(B) Correlation of Vrev and resting potential for 15 pyramidal cells. Reversal potentials were depolarizing with respect to rest in 9 cells (filled circles), above the diagonal line, and hyperpolarizing in 6 cells (open circles) below the line. The proportion of pyramidal cells depolarized by GABA during IIDs (black part of the histogram- Depol vs white part - Hyperpol) was significantly higher in tissues with tumor infiltration than in tissues with no infiltration (p=0.019, Fisher exact test).
(C) Blocking the K-Cl cotransporter NKCC1 with bumetanide (8 μM) reversibly suppressed spontaneous IID field potentials.
(D) Western blot for NKCC1 (left) and KCC2 (right) of both control (n=4) and glioma (n=7) human tissues. All results were normalized using beta III tubulin neuronal-specific marker. Histogram representing normalized NKCC1 protein quantification shows that NKCC1 is significantly increased in glioma samples as compared to controls (p=0.02). Histogram representing normalized KCC2 protein quantification shows that KCC2 is significantly decreased in glioma samples as compared to controls (p=0.04).
(E) Illustrations of KCC2 immunoreactivity stained with NeuN marker. Left, the fluorescence is distributed along the plasma membrane (arrow head) of the cells in controls. Middle, in glioma sample, the distribution of KCC2 immunoreactivity in neurons of infiltrated neocortex is modified from membrane staining (open arrow head), staining in the cytoplasmic region (filled arrow head) to a loss of staining (open circle). Right, the quantification of KCC2 fluorescence repartition per cell shows a significant decrease of membrane staining (p=0.01) and a significant increase in the loss of staining in glioma samples (p=0.04), as compared to controls. Scale bar, 10 μm.

