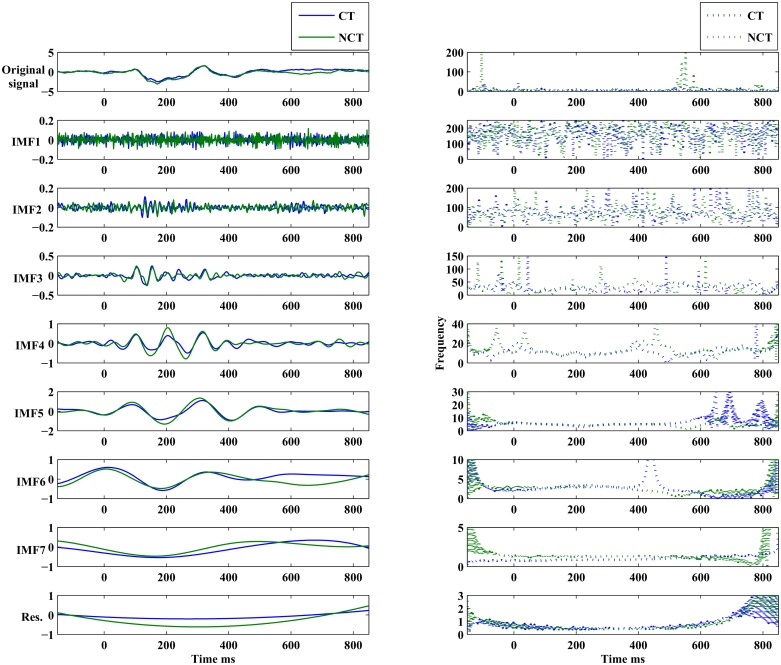
Fig 7. EEMD decomposition on grand average ERPs.
Single subject ERPs were averaged over 18 subjects and are shown for two stimulus conditions: Contour and Non-contour. This signal is generated by averaging all signals from Fig 3 for the two conditions separately. Plots in the left column represent the averaged signal (on top) followed by its event-related intrinsic modes (ERMs). Plots in the right column present related Hilbert spectra for each of the corresponding ERMs in the left column.

