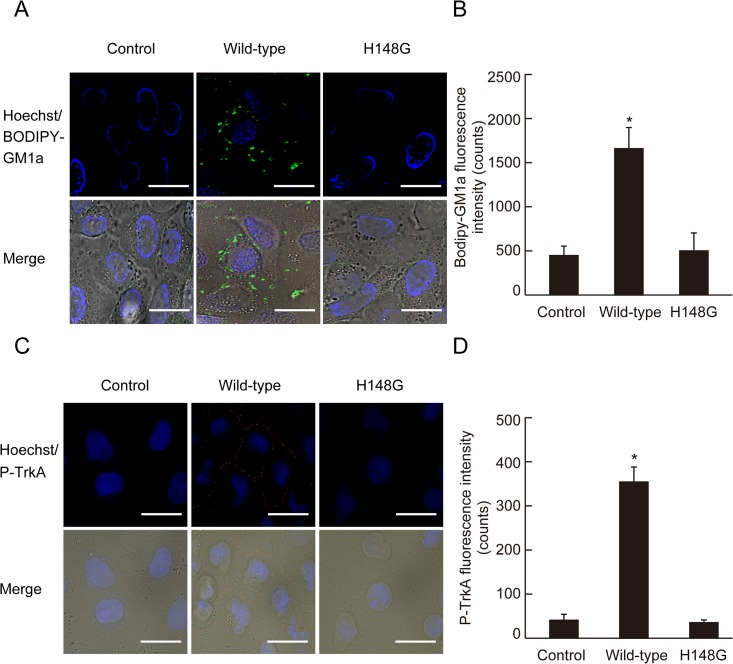
Fig 3. Clustering of GM1a and phosphorylation of TrkA in the membrane of cells treated with alpha-toxin.
(A) A549 cells stained with BODIPY-GM1a were incubated with 1.0 μg/mL wild-type alpha-toxin or H148G alpha-toxin at 37°C for 60 min. The cells were fixed in 4% paraformaldehyde and stained with Hoechst 33342. GM1a (green) and nuclei (blue) were visualized by fluorescence microscopy. Scale bar, 10 μm. (B) Bodipy-GM1a fluorescence intensity was measured as described in Materials and Methods. Values represent the mean ± SE; n = 3; *, p < 0.01. (C) A549 cells were incubated with 1.0 μg/mL wild-type or H148G alpha-toxin at 37°C for 60 min. The cells were fixed, permeabilized, and stained with phospho-TrkA antibody and Hoechst 33342. Phospho-TrkA (red) and nuclei (blue) were visualized by fluorescence microscopy. Scale bar, 10 μm. (D) Phospho-TrkA fluorescence intensity was measured as described in Materials and Methods. Values represent the mean ± SE; n = 5; *, p < 0.01.

