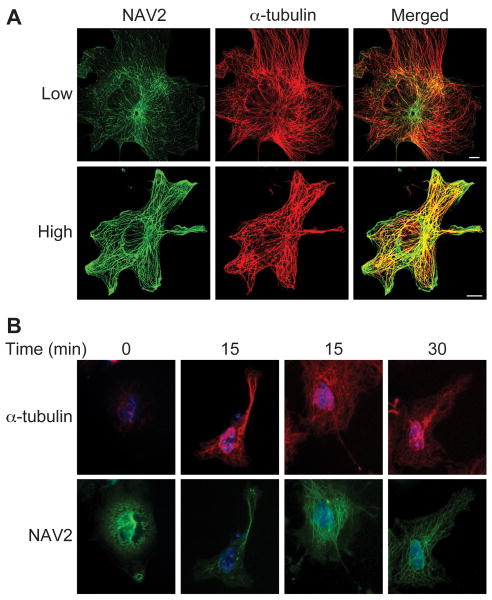
Fig. 5. NAV2 protein overexpressed in Cos-1 cells distributes similarly to that of endogenous α-tubulin.
Construct NAV2-pIRES-hrGFP-1α (C-terminal 3× flag tag) was transfected into Cos-1 cells, and 24 h later cells were fixed and stained with mouse monoclonal anti-flag and rabbit polyclonal anti α-tubulin antibodies. (A) Confocal images of cells expressing different amounts of NAV2 protein defined as low or high. At low levels, NAV2 is distributed in a punctate fashion along the length of the microtubules; at high levels the protein appears distributed along the length of the microtubules and causes thickening or bundling. (B) Cos-1 cells were transfected with full-length Nav2 pMES construct, and 24 h later microtubules were depolymerized and repolymerized as described in Methods. NAV2 protein lags in its apparent re-association with the polymerizing microtubules. At 0 min, NAV2 protein is diffusely distributed throughout the cell (panel B, column 1). At 15 min some cells show a focused distribution in association with reforming microtubules whereas other NAV2 staining remains diffuse (panel B, columns 2 and 3). By 30 min NAV2 protein shows an expression pattern similar to α-tubulin (5B, column 4). Scale bar is 10 μm.

