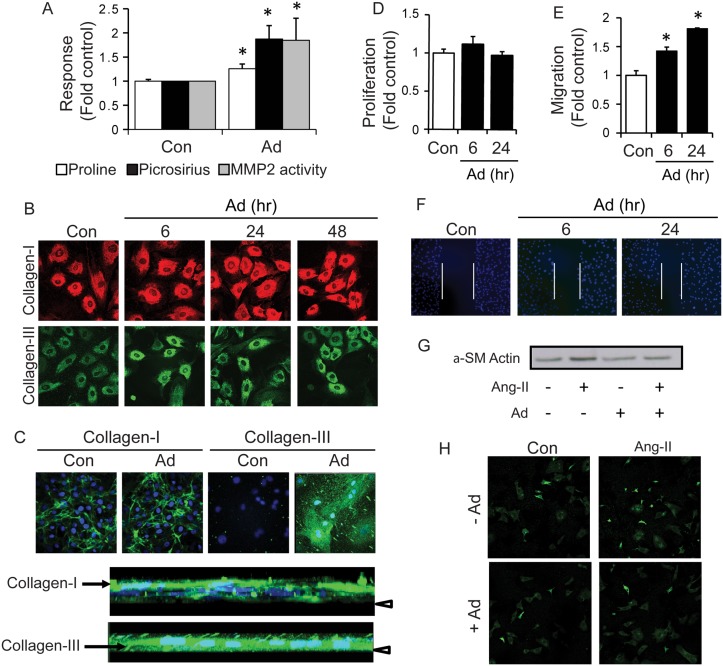
Fig 8. Adiponectin increases collagen synthesis and secretion, and MMP2 activation from cardiac fibroblasts.
Adiponectin stimulation of isolated neonatal cardiac fibroblasts was followed by analysis of: (A) Intracellular pro-collagen synthesis was assessed by 3H-proline incorporation following adiponectin treatment (5 μg/mL) for 6, 24 or 48 h. Data represent mean values ± SEM from n = 3 experiments using 3 wells per group for quantification. Total secreted collagen was measured in fibroblast conditioned media following adiponectin treatment for 6, 24 or 48 h by picrosirius red staining. MMP2 activation was analyzed by gelatin zymography in conditioned media collected from 6, 24 and 48 h adiponectin treated fibroblasts. Data represented as mean arbitrary units ± SEM from n = 7 experiments. (B) Immunofluorescent images of intracellular collagen I (red) and collagen III (green) synthesized in cardiac fibroblasts at 60x magnification. Cells were treated with adiponectin for 6, 24 and 48 h. Representative images from n = 3 experiments are shown. (C) Immunofluorescent images of extracellular collagen I (green) and collagen III (red) secreted from cardiac fibroblasts at 60x magnification. Cells were treated with adiponectin for 3 days. Cell nuclei were also stained with DAPI (blue). Representative images from n = 3 experiments are shown. Below, 3-dimensional stacks of Ad-treated NCFs immunostained for Collagen I and Collagen III were rotated to show relative vertical orientation of nuclei (DAPI) and collagen (green). Arrow head indicates coverslip. (D) Fibroblast proliferation was assessed by 3H-thymidine incorporation following adiponectin treatment for 6, 24, or 48 h. Data represent mean values ± SEM from n = 3 experiments using 3 wells per group for quantification. (E) Fibroblast migration was assessed using the wound-scratch assay following adiponectin treatment for 6 or 24 h. Cell nuclei were stained with DAPI and imaged using confocal microscopy under a 20x objective. Data represent mean values ± SEM from n = 3 experiments using 7–10 images per group for quantification. Representative images are shown in (F). (G) Western blot analysis of cardiac fibroblast cell lysates treated with adiponectin (5 μg/mL) and/or pre-treated with AngII (1 μM). (H) Immunofluorescent staining for αSMA in cardiac fibroblasts treated with adiponectin and/or pre-treated with AngII (1 μM), and imaged using confocal microscopy under a 20x objective.

