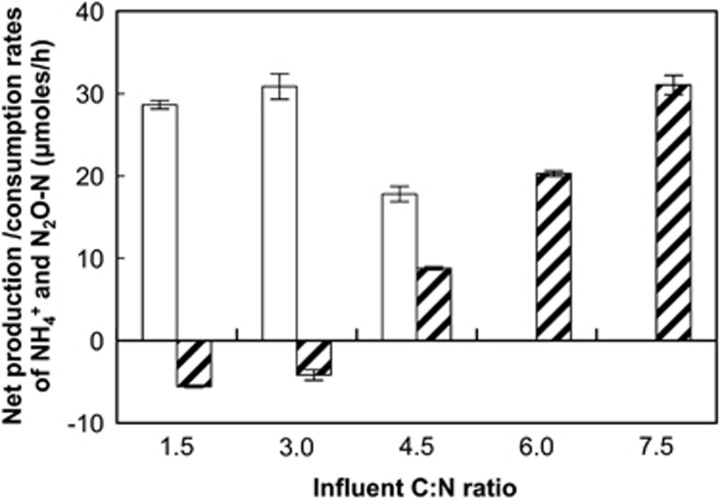
Figure 2.
Net production of N2O (white bars) and NH4+ (shaded bars) in S. loihica strain PV-4 chemostat cultures with C/N ratios varying from 1.5 to 7.5 in the feed solution. The feed solution contained 2 mM NO3− and was delivered at a rate of 20 ml h−1. Rates of respiratory ammonification were calculated from the input and steady-state concentrations of NH4+, whereas denitrification rates were calculated by measuring N2O production rates following the addition of 10% (vol/vol) acetylene gas to the reactor vessel headspace. At C/N ratios of 1.5 and 3.0, net consumption of NH4+ occurred. The bars represent the averages of two separate measurements taken on different days after steady-state conditions had been reached. The error bars show the s.d. of two measurements taken with a 24-h interval.

