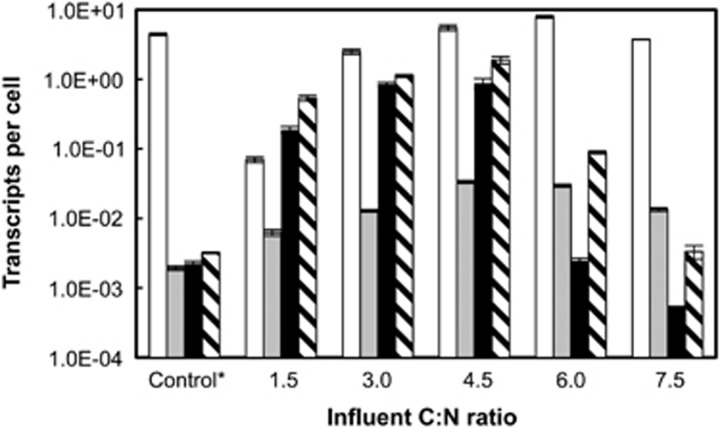
Figure 3.
Reverse-transcriptase (RT)-qPCR analyses of nrfA0844 (white bars), nrfA0505 (gray bars; respiratory ammonification), nirK (black bars) and nosZ (hashed bars; denitrification) transcripts in S. loihica strain PV-4 under varying C/N ratios. The error bars represent the s.d. of triplicate per-cell transcript copy numbers calculated from the s.d. of qPCR measurements for cDNA and genomic DNA using the error propagation method. The results of an independent replicate experiment are shown in Supplementary Figure S3. *The control is the transcript copy number of each gene in the sample extracted from the steady-state reactor incubated with fumarate as the electron acceptor.

