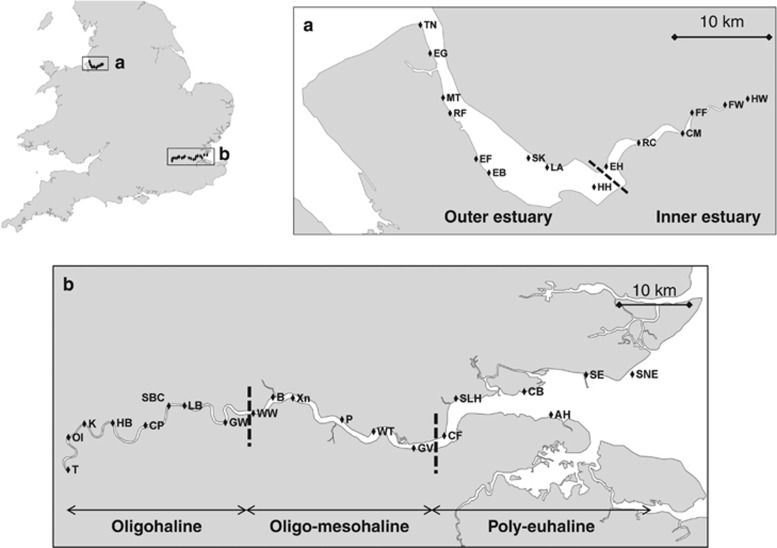
Figure 1.
Map of the sampling locations. (a) Mersey estuary. CM, Cuerdley Marsh; EB, Ellesmere Bank; EF, Eastham Ferry; EG, Egremont; EH, East Hale; FF, Fiddlers Ferry; FW, Forest Way; HH, Hale Head Shore; HW, Howley Weir; LA, Liverpool Airport; MT, Mersey Tunnel; RC, Runcorn; RF, Rock Ferry; SK, Speke; TN, The Narrows. (b) Thames estuary. AH, Allhallows; B, Beckton; CB, Cavney Island; CF, Coalhouse Fort; CP, Cadogan Pier; GV, Gravesend; GW, Greenwich; HB, Hammersmith Bridge; K, Kew; LB, London Bridge; OI, Old Isleworth; P, Purfleet; SBC, South Bank Centre; SE, Southend-on-Sea; SLH, Stanford Le Hope; SNE, Shoebury Ness; T, Teddington; WT, West Thurrock; WW, Woolwich; XN, Crossness. Salinity zones have been named according to the Venice salinity classification system: oligohaline (0.5–5‰), mesohaline (5–18‰), polyhaline (18–30‰), euhaline (30–40‰) and hyperhaline (>40‰).

