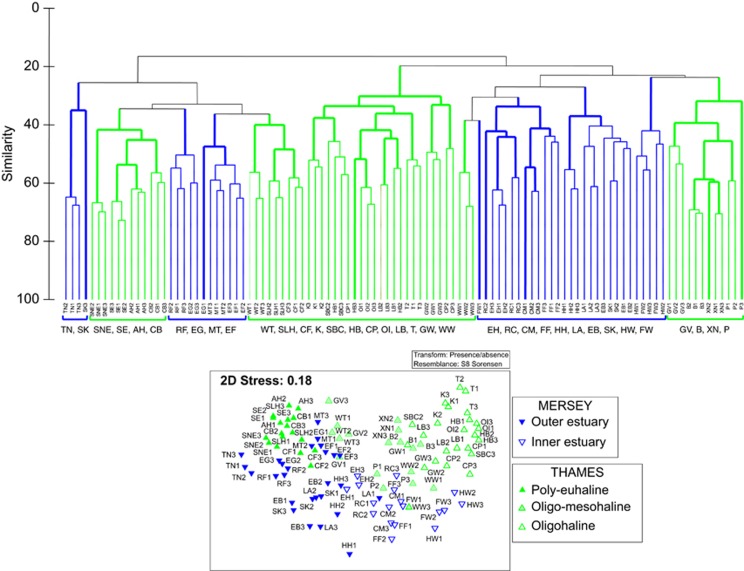
Figure 4.
Cluster analysis and multidimensional scaling (MDS) ordination for taxonomic patterns of meiofaunal communities based on Sørensen similarities of OTU presence/absence data for the combined estuaries. In the dendrogram, thick lines represent samples that are significantly differentiated based on a SIMPROF (‘similarity profile' permutation tests) analysis. The two estuaries have been colour coded (M, Mersey in blue; T, Thames in green). See Supplementary Table S1 for site abbreviations.

