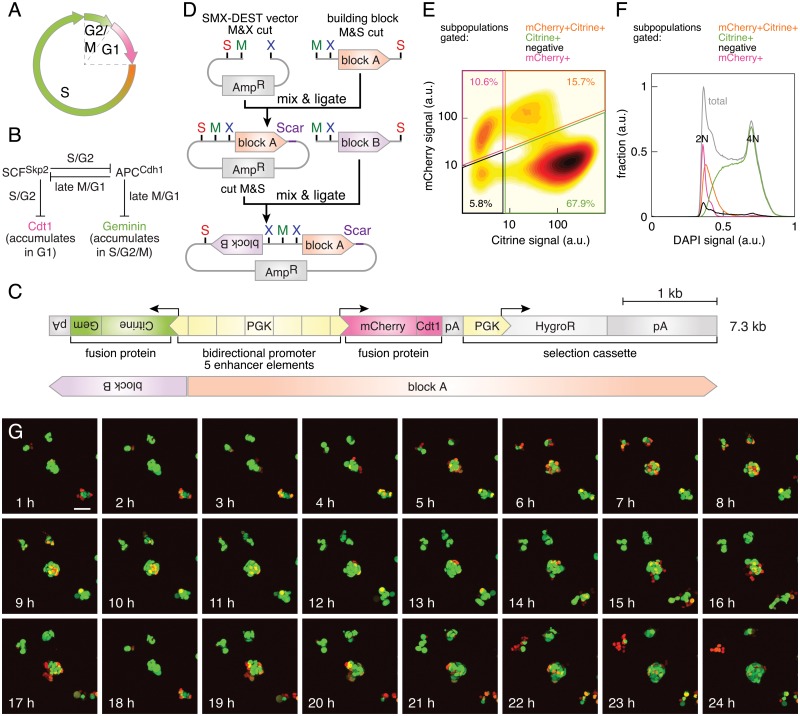
Fig 4. Adapting the FUCCI system to mouse embryonic stem cells.
(A) FUCCI labels cells in G1 phase red, cells at the transition to S phase orange and cells in late S, G2 and M phases in green. (B) Molecular mechanism behind FUCCI. A double-negative feedback loop between the SCFSkp2 and APCCdh1 complexes exhibits bistability and leads to the oscillating accumulation of their substrates Cdt1 in G1 phase and Geminin in late S, G2 and M phases (adapted from [5]). (C) Scheme of the FUCCI-based construct to monitor cell cycle progression in mESCs. Top: A bidirectional PGK-promoter containing five enhancer elements drives the expression of Citrine-Gem(aa 1–110) and mCherry-hCdt1(aa 30–120). Small gray boxes are bGHpAs, large gray boxes β-GpAs. Scale bar: 1 kb. Bottom: Orange and purple boxes indicate the identity of the building blocks, which were assembled head-to-head into the SMX_DEST vector, see as well (D). (D) Scheme of the cloning strategy using the SMX_DEST vector to arrange building blocks head-to-head. (E) Flow cytometry analysis of mCherry and Citrine fluorescence in a clonal transgenic mESC line stably expressing the construct shown in (C). The percentage of cells in each gate is shown. (F) Analysis of the cellular DNA content. DAPI signal distribution of each subpopulation outlined in (E) and of the total culture is shown. (G) Live imaging of a clonal transgenic culture expressing the construct shown in (C). Maximum intensity projections of confocal sections are displayed. Scale bar: 50 μm.

