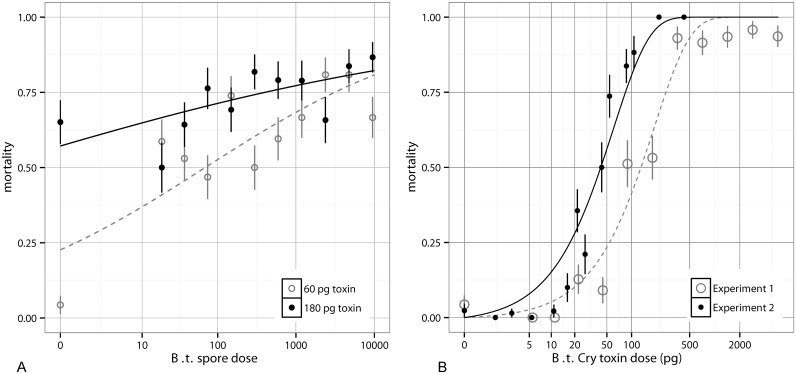
Fig 1. The effects of spores and toxin on mortality in Bacillus thuringiensis.
A) The mortality rates for varying quantities of spores of Bacillus thuringiensis a Cry null strain supplemented with 60 pg of toxin (open circles, dashed line) or 180 pg of toxin (solid circles, solid line). A glm of the form y ~ Toxins + log(Spores+1) + Toxins* log(Spores+1) is fit and shown for both toxin doses (see S2 Table in S1 Text for parameter details) with S.E. shown. In both cases spore dose has a positive impact on mortality, and in the 60 pg case, there is a gap between zero spores and the next lowest dose. B) The mortality rates for 900 Bacillus thuringiensis spores supplemented with varying quantities of toxins (+/- S.E.) in two experiments. The fit curves are from a nonlinear regression with an exponential model (Eq 1). This IAH model is not sufficiently threshold-like to describe the data; it overestimates low dose mortality.

