FIGURE 2.
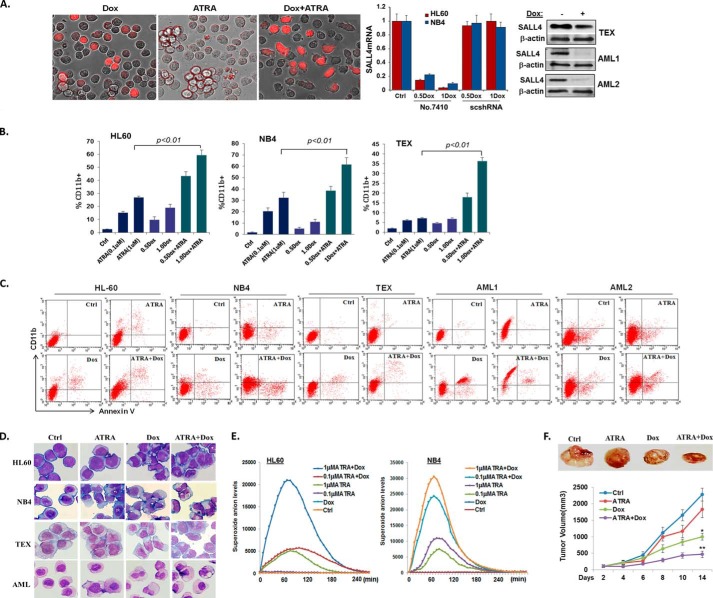
SALL4 knockdown enhances ATRA-mediated differentiation. A, HL60 cells infected with TripZ shRNA 7410 virus were treated with either ATRA (1 μm), Dox (1 μg/ml), or both for 60 h. Dox-induced TripZ-TurboRFP expression in cells was monitored, and representative pictures were taken using the EVOS fl microscope (×20). Dox-induced SALL4 knockdown in HL60 and NB4 cells was determined by qRT-PCR normalized to GAPDH levels. Error bars represent mean ± S.D. of three independent experiments. Shown is a Western blot analysis revealing SALL4 depletion after 3 days of Dox (1.2 μg/ml) induction in the TEX cell line (representing at least three repeats) and patient-derived primary AML cells. Ctrl, control. B, flow cytometry assays were performed for the indicated cell lines after ATRA induced cell differentiation with or without Dox (shown as micrograms per milliliter)-mediated SALL4 knockdown. Error bars represent mean ± S.D. of four independent experiments. C, representative flow cytometry assays showing CD11b and annexin-V expression levels in differentially treated cell lines or primary patient (AML-M2) blast samples. D, the cell morphology of the indicated cells was analyzed by May-Grünwald-Giemsa staining after treatment with the indicated drugs for 60 h. Pictures were taken through a Nikon Eclipse 90i microscope (×60). E, HL60 and NB4 cells were treated with the indicated drugs and analyzed with a superoxide anion production kit. The kinetic curve shows luminescence changes when measured with a SpectraMax® M3 microplate reader. F, ATRA and SALL4 knockdown suppress AML tumor growth in vivo. Drug treatments were started 10 days after tumor cell injection. Palpable tumors were present for the established tumor model before initiating drug treatment. Dox (added to 250 ml of drinking water at a final concentration of 1 mg/ml), ATRA (15 mg/kg), or vehicle (30 ml of dimethyl sulfoxide and 70 ml of water) were injected intraperitoneally twice per day for 1 week, followed by once a day for 1 week and every other day for the third week. Dox was fed to mice for the entire 3 weeks. Top panel, the results are representative of the samples in each group. Bottom panel, tumor volume growth curves are expressed as the mean ± S.E. (n = 4 per group). Data were analyzed by Student's t test.

