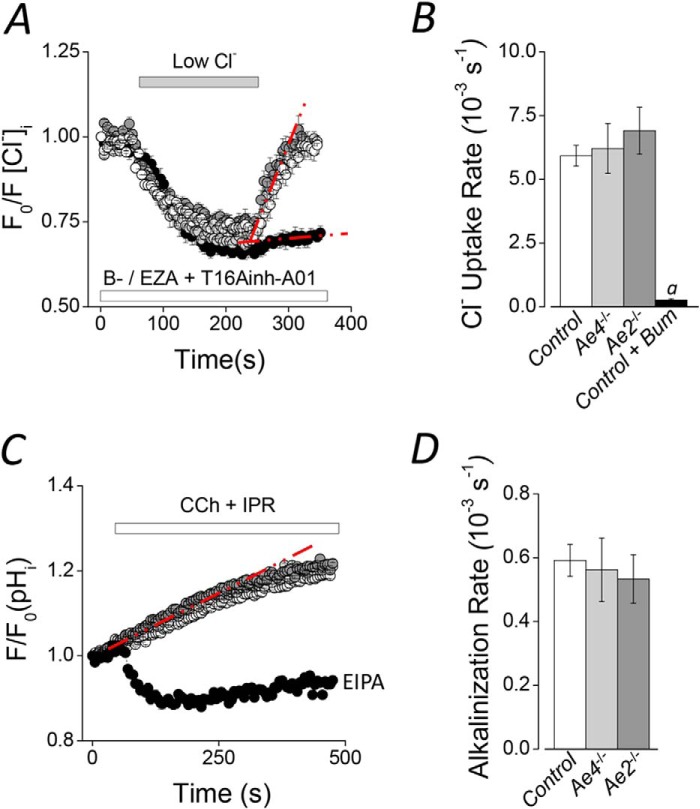
FIGURE 2.
Na+-K+-2Cl− cotransporter and Na+/H+ exchanger activities in Ae2−/− and Ae4−/− mouse acinar cells. Cl− uptake experiments were performed in SPQ-loaded acinar cells from Ae2−/− and Ae4−/− mice. HCO3−-free solutions (B−) containing 30 μm ethoxyzolamide (EZA) and 50 μm T16Ainh-A01 were used. A, after intracellular Cl− was depleted in a low Cl− bath solution, Cl− uptake was initiated by the addition of high Cl− in Ae4−/− (light gray symbols), Ae2−/− (dark gray symbols), and control mice (open symbols). After the initial intracellular Cl− depletion of control cells, 50 μm bumetanide (Bum) was included to inhibit Nkcc1 Na+-K+-2Cl− cotransporter activity (black symbols). B, summary of the initial Cl− uptake rates calculated from experiments like those shown in A from the regions indicated with the dashed red lines (control, n = 16; Ae4−/−, n = 8; Ae2−/−, n = 10; control + bumetanide, n = 9). Analysis of variance followed by Bonferroni's post hoc test was performed. a, significant difference from control, Ae4−/−, and Ae2−/− relative to control + bumetanide (p < 0.001). C, the intracellular pH was measured in BCECF-AM-loaded acinar cells stimulated with 0.3 μm CCh and 5 μm IPR during the indicated time. An alkalinization was recorded in Ae4−/− (light gray symbols), Ae2−/− (dark gray symbols), and control mice (open symbols). The initial alkalinization was changed to an acidification when cells were exposed to an Na+/H+ exchange inhibitor (10 μm (EIPA), black symbols, n = 7). D, summary of the initial alkalinization rates calculated from experiments like those shown in C from the regions indicated with the dashed red line. Control, n = 13; Ae4−/−, n = 8; Ae2−/−, n = 6. Results are given as means ± S.E. (error bars). Data from Ae4 WT and Ae2 control mice are shown as a single bar in B and D because they were not statistically different. Representative experiments are shown in A and C.

