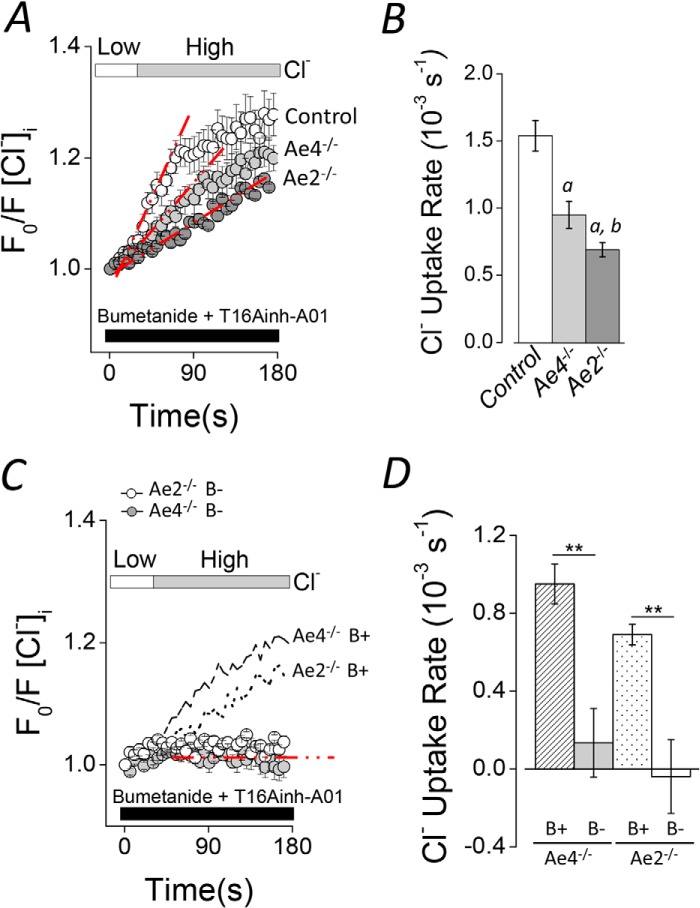
FIGURE 4.
Altered Cl− uptake in Ae4−/− and Ae2−/− mouse acinar cells. Cl− uptake experiments were performed as described in the legend to Fig. 3 in HCO3−-containing solutions (B+). Cl− reuptake is shown as normalized data. A, shifting to a high Cl− bath solution elicited Cl− uptake in Cl−-depleted acinar cells of control mice (open symbols). Cl− uptake was slower in Ae4−/− and Ae2−/− (light gray and dark gray symbols, respectively). B, summary of the initial rates of Cl− uptake for experiments like those shown in A. Initial rates were calculated as in Fig. 3. Data from Ae4 WT and Ae2 control mice are shown as a single bar because they were not statistically different (Ae4 WT, n = 7; Ae4−/−, n = 8; Ae2 control, n = 8; Ae2−/−, n = 10). Analysis of variance followed by Bonferroni's post hoc test was performed. a, different from control (p < 0.01); b, different from Ae4−/− (p < 0.05). C, Cl− uptake was absent in HCO3−-free solutions (B−) containing 30 μm EZA when cells were shifted from a low to a high Cl− bath solution in Ae4−/− mice (gray symbols) and Ae2−/− (open symbols). Data from experiments performed in HCO3−-containing solutions (B+) are replotted from A for comparison (dashed line, Ae4−/−; dotted line, Ae2−/−). D, summary of the initial rates of Cl− uptake (Ae4−/− B− (gray bar), n = 5; Ae2−/− B− (open bar), n = 3). Data from Ae4−/− and Ae2−/− in B+ solutions are replotted for comparison (dashed and dotted bars, respectively). **, p < 0.001, Student's t test. All results are given as means ± S.E. (error bars). Representative experiments are shown in A and C.

