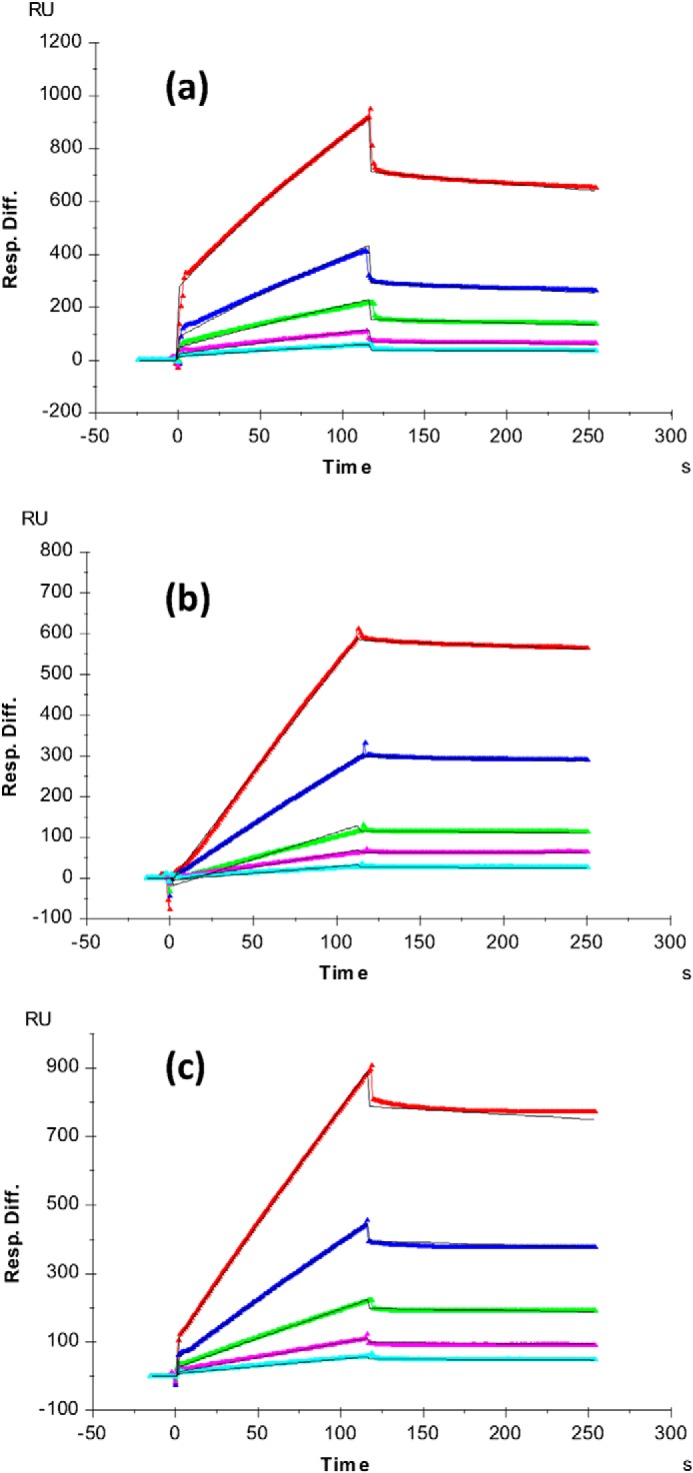
FIGURE 9.

SPR sensorgrams of Robo1-heparin interaction. a, Robo1 WT/heparin; b, Mutant I (R136A/K137A)/heparin; c, Mutant II (R62A/R69A)/heparin. Concentrations of Robo1 (from top to bottom) are as follows: 1000 nm (red), 500 nm (blue), 250 nm (green), 125 nm (magenta), and 63 nm (cyan). The black curves are the fitting curves from a 1:1 Langmuir model from BIAevaluate version 4.0.1. Resp. Diff., response difference.
