FIGURE 5.
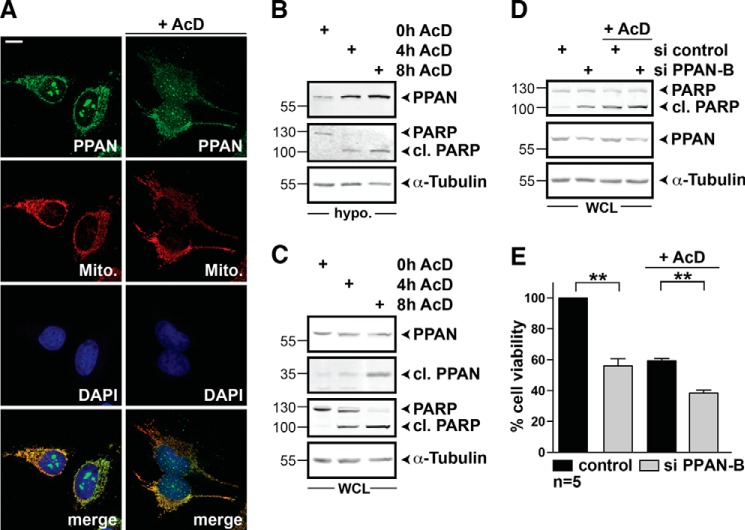
AcD triggers PPAN accumulation and cleavage in hypotonic extracts and PPAN knockdown sensitizes cells to AcD-mediated apoptosis. A, AcD treatment disturbs nucleolar localization of PPAN as monitored by confocal imaging. HeLa cells were incubated with AcD for 4 h as indicated and stained for PPAN, mitochondria (MitoTracker = Mito.), and nuclei (DAPI) as depicted within the panels. Scale bar, 10 μm. B, AcD increases PPAN levels in hypotonic extracts. HeLa cells were exposed to AcD for 4 and 8 h as indicated. The control (0h AcD) was incubated with DMSO. A representative Western blot of hypotonic (hypo.) extracts probed for PPAN, PARP, and α-tubulin is shown. C, AcD induces PPAN cleavage. HeLa cells were exposed to AcD as shown on top of the panel. A representative Western blot of whole cell lysates (WCL) probed for PPAN, PARP, and α-tubulin is shown. After 4 h of AcD, a lower molecular mass band of 35 kDa is detected by PPAN antibodies indicating PPAN cleavage. PPAN 55 and 35 kDa was detected on the same blot; however, a darker exposure of the middle panel (35 kDa) is shown. The experiments are representative of three independent experiments. D, PPAN knockdown elevates apoptosis in presence and absence of AcD. HeLa cells were transfected with si control and si PPAN-B as indicated above panels and incubated with AcD or DMSO for 3 h. Whole cell lysates were subjected to Western blotting as indicated. Induced apoptosis was monitored by PARP cleavage. The Western blot is representative of three independent experiments. E, PPAN knockdown impairs cell viability as observed by WST-1 assay. siRNA-mediated knockdown of PPAN impairs WST-1 cleavage and further abrogates AcD-mediated loss of cell viability as compared with controls. HeLa cells were transiently transfected with indicated siRNAs and analyzed by WST-1 colorimetric measurement. Where indicated, cells were exposed to 10 μm AcD for 3 h prior to measurement. Unstimulated controls were set to 100% cell viability. Error bars show S.E.M., statistically significant differences are indicated; **, p < 0.005. n = number of independent experiments.

