FIGURE 5.
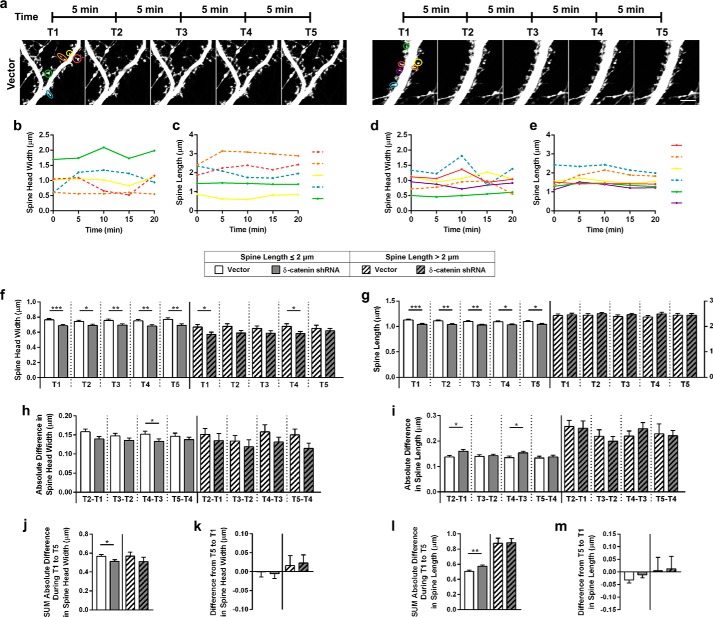
Knockdown of δ-catenin alters spine dynamics. a, representative images of dendritic segments from neurons expressing vector and shRNA at indicated time points. b, spine head widths from spines, expressing vector; c, spine lengths from spines, expressing vector; d, spine head widths from spines, expressing shRNA; e, spine lengths from spines, expressing shRNA, at time points indicated for color coded spines as indicated in first panel of a. Solid lines, spine lengths of spines less than or equal to 2 μm in length and dashed lines for spines greater than 2 μm in length. f, spine head widths of spines less than or equal to 2 μm in length and greater than 2 μm in length at the time points indicated. g, spine lengths of spines less than or equal to 2 μm in length and greater than 2 μm in length at the time points indicated. The scale on the right is for the group with lengths greater than 2 μm. h, absolute differences in spine head width for the two groups at the time points indicated. i, absolute differences in spine length for the two groups at the time points indicated. j, sum of absolute differences in spine head width from T1 (0 min) to T5 (20 min) in spines from the two groups. k, difference in spine head width from T5 (20 min) to T1 (0 min) in spines from the two groups. l, sum of absolute differences in spine head length from T1 (0 min) to T5 (20 min) in spines from the two groups. m, difference in spine length from T5 (20 min) to T1 (0 min) in spines from the two groups (p values: *, <0.05; **, <0.005; ***, <0.0005, Student's t test; scale, 5 μm).

