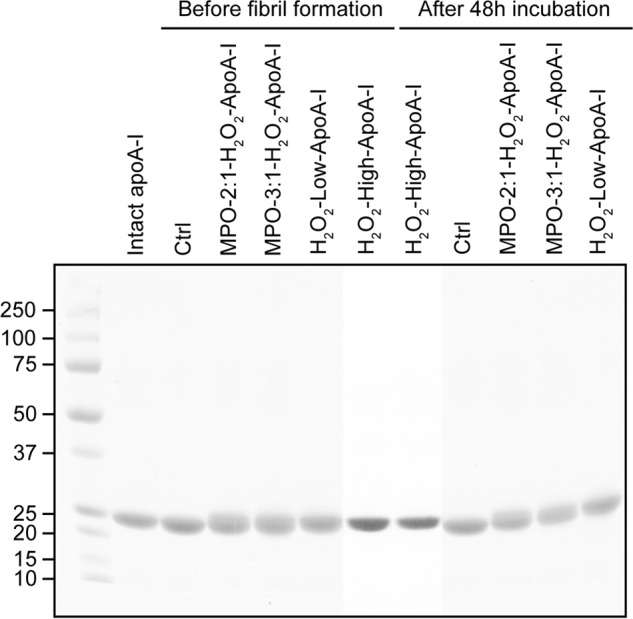
FIGURE 1.

SDS-PAGE analysis of apoA-I samples after oxidation and after 48 h under fibrillation conditions. The figure represents a composite image in which lanes from two electrophoretic runs were combined by alignment of the Mr markers (Precision Plus protein standards, Bio-Rad).
