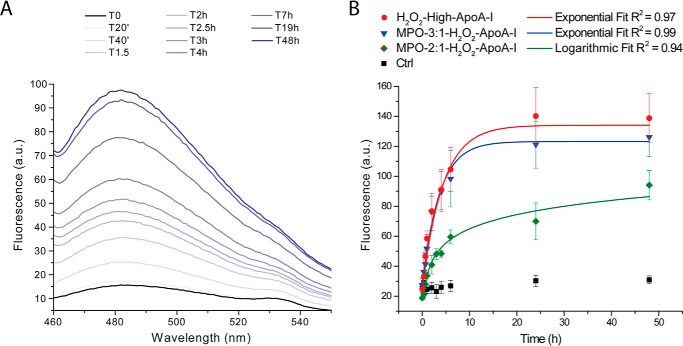
FIGURE 2.
Kinetics of amyloid fibril formation by ThT fluorescence. At the indicated time points, an aliquot of the mixture incubated under fibrillation conditions was added to a ThT stock solution, and the fluorescence emission spectrum of the sample was recorded as described under “Experimental Procedures”. Panel A, representative ThT fluorescence emission spectra time course of H2O2-high-apoA-I. Panel B, comparison of the fibrillation kinetics of H2O2-high-apoA-I (red), MPO-3:1-H2O2-apoA-I (blue), and MPO-2:1-H2O2-apoA-I (green). Reported values are the means of the intensities of ThT fluorescence emission at the maximal emission wavelength. Error bars are S.E. for 3–5 independent experiments, as defined under “Experimental Procedures.” ApoA-I samples (black) were incubated under the same oxidation conditions as the H2O2-oxidized samples but in the absence of H2O2. Solid lines are the fit of mean experimental values by exponential or logarithmic curves, as indicated in the figure. a.u., arbitrary units.

