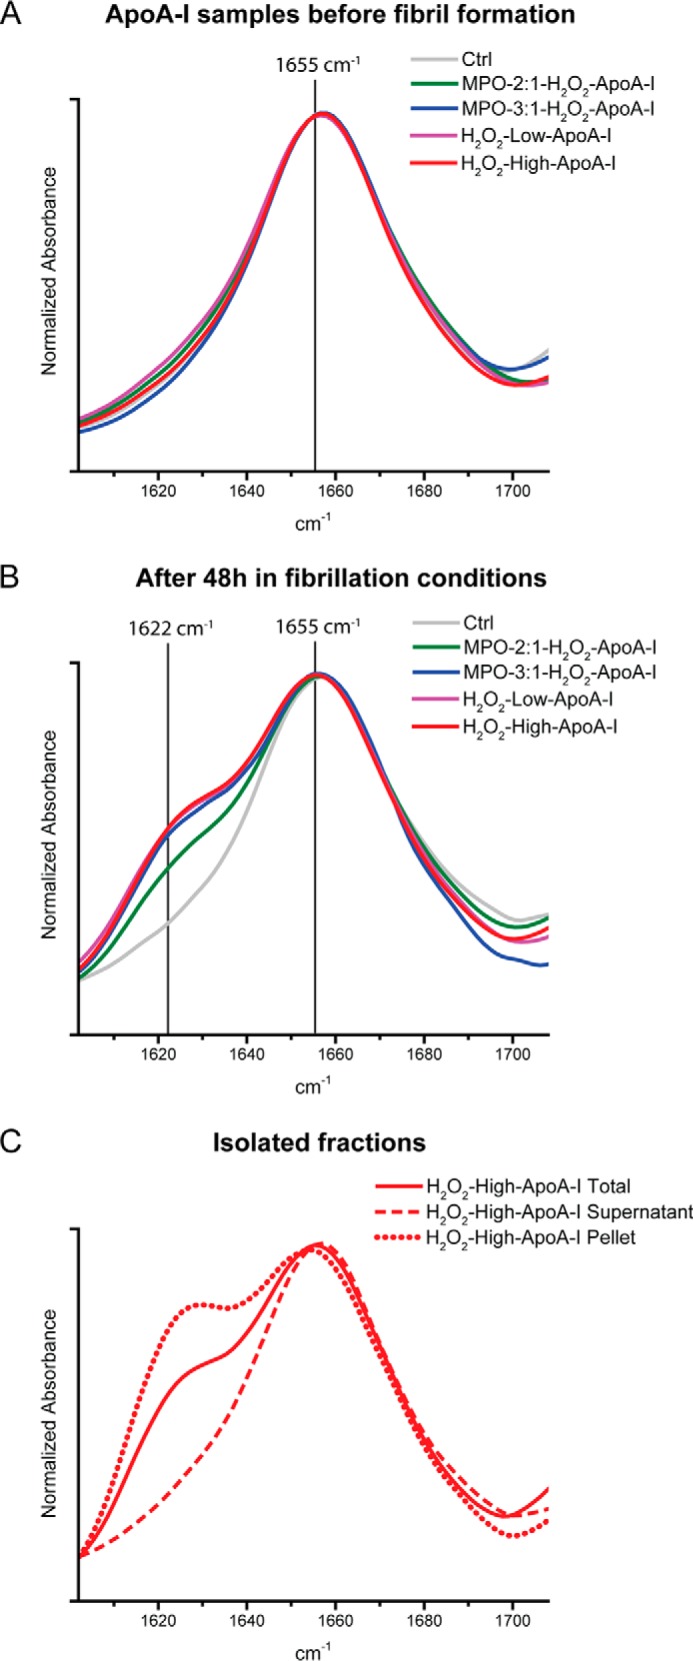
FIGURE 4.

FTIR spectra in the amide I region (1602–1708 cm−1) of apoA-I samples. Control and oxidized samples before fibrillation (panel A) and after 48 h under fibrillation conditions (panel B) are shown. Panel C, FTIR analysis of supernatant and solid material isolated from H2O2-high-apoA-I.
