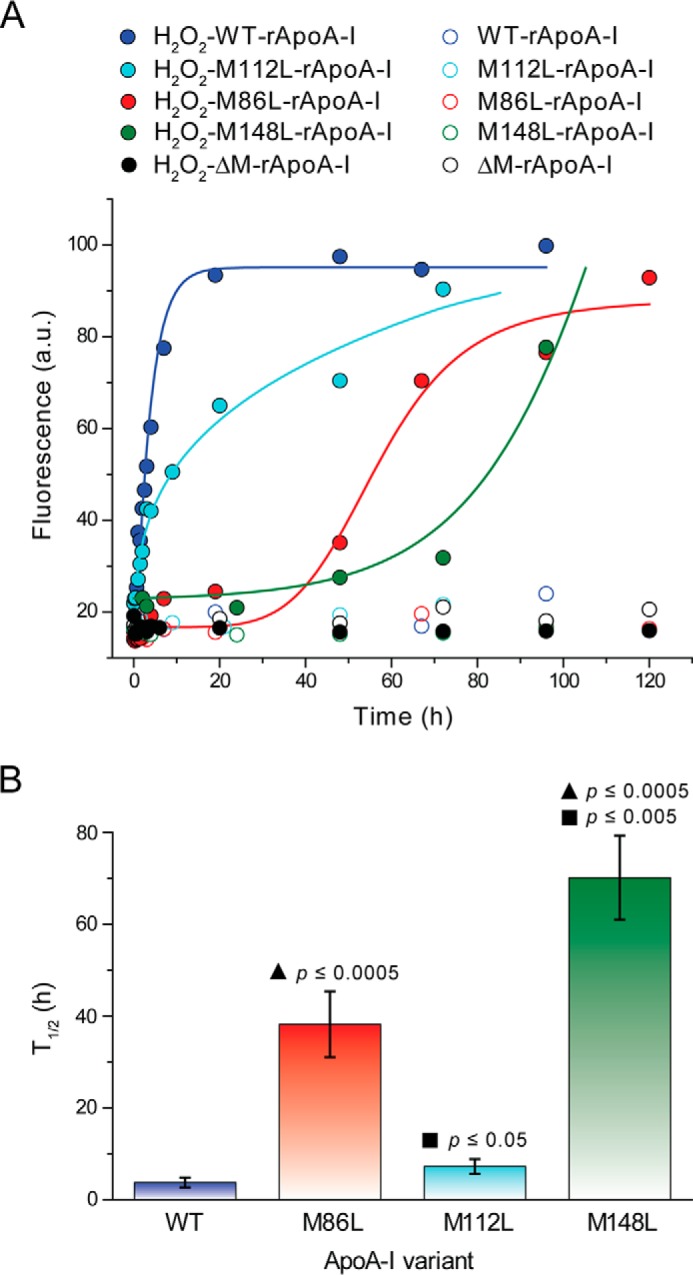
FIGURE 8.

Kinetics of amyloid fibril formation by Met-to-Leu apoA-I variants after oxidation with a 750:1 molar excess of H2O2. ThT fluorescence was measured as described in Fig. 2 and under “Experimental Procedures.” Panel A, representative kinetics of amyloid fibril formation by H2O2-WT-rapoA-I, H2O2-M86L-rapoA-I, H2O2-M112L-rapoA-I, H2O2-M148L-rapoA-I, H2O2-ΔM-rapoA-I (solid symbols), and the corresponding non-oxidized controls (open symbols). Solid lines are the fit of the experimental values by exponential growth curves for H2O2-WT-rapoA-I and H2O2-M112L-rapoA-I and sigmoidal curves for H2O2-M86L-rapoA-I and H2O2-M148L-rapoA-I (logistic model and dose-response model, respectively). a.u., arbitrary units. Panel B, t½ were calculated from the data fitting and defined as the time at which the ThT fluorescence reached 50% of the maximal value measured for H2O2-WT-rapoA-I. Reported values are the means and S.E. for 3–11 independent experiments, as defined under “Experimental Procedures.” ▴, probability that the reported mean value is not different from t½ of H2O2-WT-rapoA-I. ■, probability that the reported mean value is not different from t½ of H2O2-M86L-rapoA-I.
