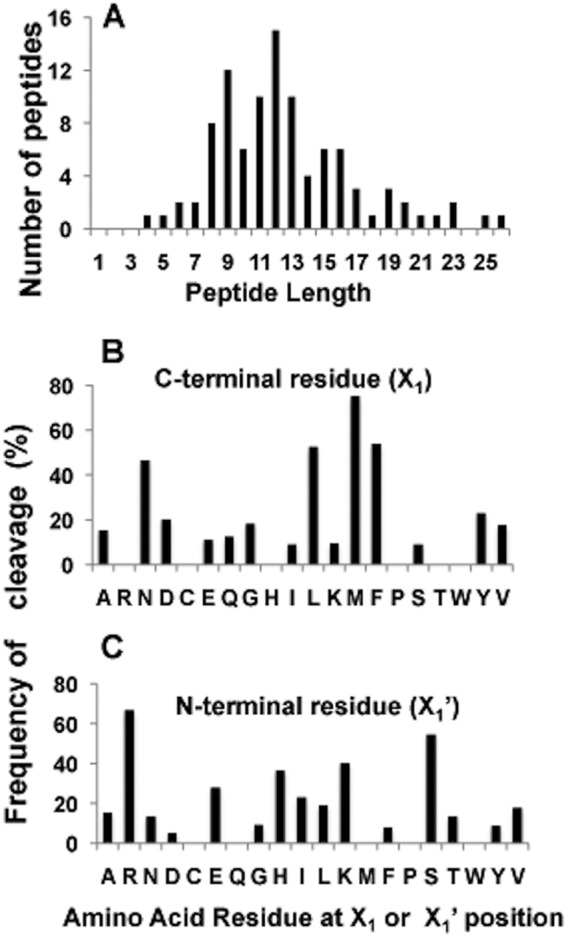
FIGURE 5.

Size distribution of peptide products and cleavage preferences for ClpP1P2. A, size distribution of individual peptides generated after cleavage of GFPssrA. Protein substrate was digested by ClpP1P2 in buffer A containing 1 μm GFPssrA, 75–100 nm ClpP1P2, 300–400 nm ClpX, and 2 mm Mg-ATP. The produced peptides were separated by centrifugal filter (10 kDa) and analyzed using Liquid LS-MS/MS. B and C, cleavage preferences for X1 and X1′ positions during GFPssrA degradation. The number of cleavages after and before a given amino acid is presented as a percent of the total number of that amino acid in the protein sequence. Peptides were generated and analyzed as in A.
