
FIGURE 4.
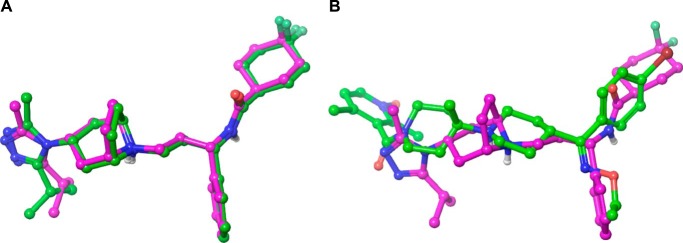
Automatic docking of small molecules to CCR5. Computationally derived docking modes are shown with carbons in green; the binding mode obtained by crystallography is shown with carbons in magenta. A, successful method evaluation as self-docking reproduces the crystal binding mode of maraviroc to CCR5. For clarity, only the small molecules are shown as the receptor was kept rigid in the docking process. B, aligned docking poses of maraviroc and SCH-C.