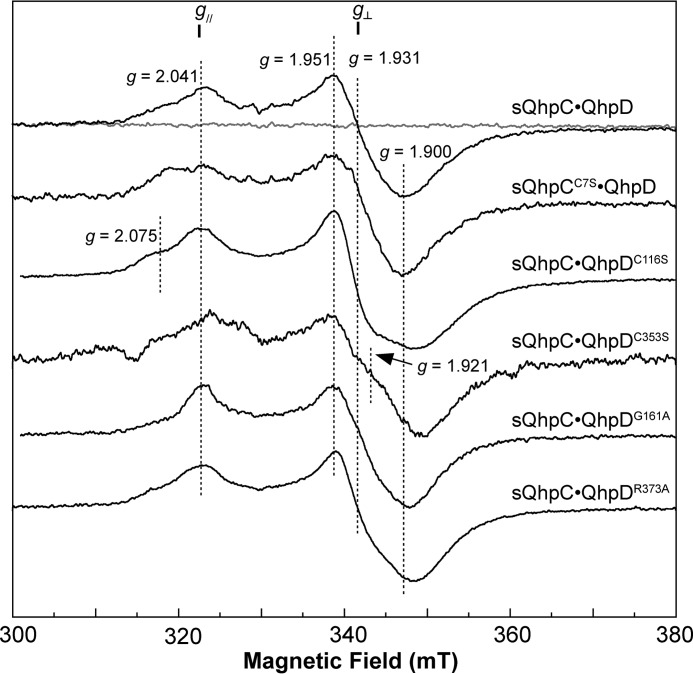
FIGURE 6.
EPR spectra of wild-type and mutant QhpD complexes with sQhpC or sQhpCC7S. The X-band EPR spectra of the reconstituted sQhpC·QhpD, sQhpCC7S·QhpD, sQhpC·QhpDC116S, sQhpC·QhpDC353S, sQhpC·QhpDG161A, and sQhpC·QhpDR373A complexes (80 μm) are shown with important g values including those for g‖ and g⊥ signals. X-band (9.23 GHz) microwave frequency spectra before (gray) and after (black) the addition of 2 mm DT were recorded at 15 K with modulation frequency, 100 kHz; modulation amplitude, 1 millitesla (mT); and microwave power, 10 milliwatts.

